
Analysis / Surface / North America
Regions: North America | Quebec | Canada | USA | Europe | France | UK
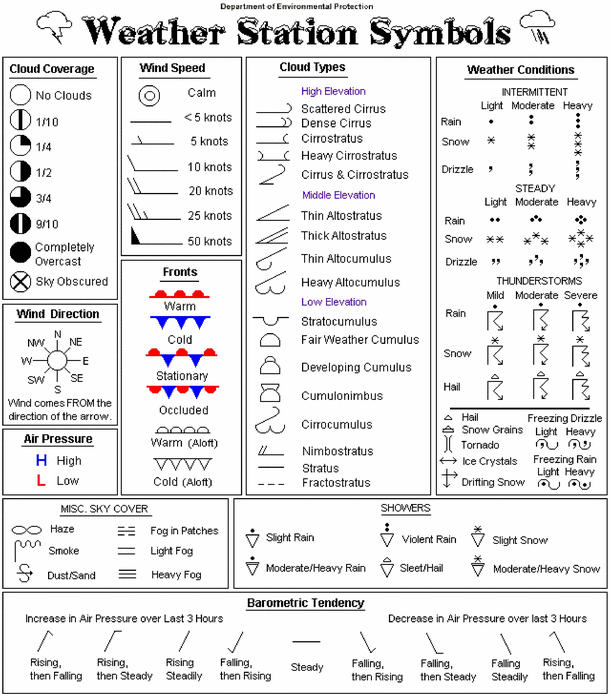
Weather symbol legends
- Red (upper-left): temperature (°C)
- Green (lower-left): dewpoint (°C)
- Blue (upper-right): abbreviated mean sea-level pressure in hPa (=mb). To get the pressure value, just put a 10 or a 9 in front of the displayed value and divide by 10: only one of these choices will give a realistic value.
- Magenta (center-left): weather symbol
- Blue (center): cloud cover in octa
- Blue (barb): wind speed in knots and wind direction
- Orange: pressure tendency in the last 3 hours in tenth of hPa
- Purple (left-upper-left): Wind gust in knots
- Upper-center and lower-center (few stations): cloud type symbols
- Black lines: pressure (hPa=mb) lines each 4 hPa analyzed with Barnes algorithm from surface observations and first guess model data (digital filter)
- Red dashed-lines: geopotential height at 500 hPa each 6 dam analyzed with Barnes algorithm from upper-air observations and first guess model data
Decoding time stamp example:
sfc/251104/0900 upa/251104/00
sfc = Surface
251104/0900: year=2025; month=11 (November); day=04; 0900=09:00 UTC
upa = Upper-air
251104/00: year=2025; month=11 (November); day=04; 00=00 UTC
Last update : 20 February 2023
ATTENTION Downloading of any data from this server implies that you accept that the use of this data is only for personal, research or educational purposes. Do not use for flight planning purposes. UQAM declines any responsibility for the usage of these data.
Many of these pages made possible by data and software (GEMPAK, McIDAS, LDM) from the Unidata Program. Unidata is sponsored by the National Science Foundation.
![]()