Update: april
2008
CMC
WINTER SIGNIFICANT
WEATHER
DESCRIPTION OF THE “WEB”
CHARTS
1- SNOW ACCUMULATIONS
- SNOW SQUALLS
2- FREEZING RAIN/DRIZZLE - HEAVY
RAINFALL
3- BLOWING SNOW /
BLIZZARD
4- WIND CHILL – SEVERE
WINDS
ISSUE
TIMES and FORECAST PERIODS
Charts
issued at 0400Z- based on 00Z GEM regional
- 12-36h period - Valid from 12Z/d
to 12Z/d+1
- 12-48h period - Valid from 12Z/d
to 00Z/d+2
- 24-48h period - Valid from 00Z/d+1 to 00Z/d+2
Charts
issued at 1600Z- based on 12Z GEM regional
- 12-36h period - Valid from 00Z/d+1 to 00Z/d+2
- 12-48h period - Valid from 00Z/d+1 to 12Z/d+2
- 24-48h period - Valid from 12Z/d+1 to 12Z/d+2
1- SNOW ACCUMULATIONS
- SNOW SQUALLS
DESCRIPTION
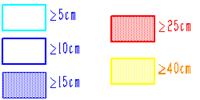
a) Snow Accumulations
Areas
where accumulations of 5 cm or more
are forecast during the valid period of the chart are displayed.
Areas
of accumulations are represented as follows:
b) Snow
squalls
Snow
squalls are indicated by magenta areas, representing all forecast occurrences
of squalls during the valid period of the chart.
Areas
are represented as follows:
![]()
DETERMINATION
OF THE AREAS
a) Snow
accumulations
Snow
accumulations are generated from the regional model QPF and the “snow” type
precipitation from the “Bourgouin” diagnostic
scheme. This diagnostic is the one used
operationally to generate precipitation types found on the 4-panel “pressure
and pressure tendency” chart, at 6-hour intervals.
Hence,
forecast snow accumulations for a given period are obtained as follows:
- the precipitation type forecast by
the model ("Bourgouin” type) is examined at the
two extremities of each 3 hour interval in the period under consideration. If it is possible to deduce that there will
be no change of precipitation type during a given 3-hour interval, and only
snow is expected during this period, then the QPF for this interval is
considered to be “snow”. For this to
happen, one of the following combinations of types must be forecast at the extremities
of the 3-hour interval:
T T+3h
Nil Snow
Snow Snow
Snow Nil
where
... Nil = no precipitation
- the
QPFs for the intervals where the above combinations
of types are encountered during the integration period under consideration
(12-36h, 12-48h, 24-48h) are thus added up, 3 hour period by 3 hour period. The
forecast snow QPF is thus obtained for the entire period, and is expressed in cm, using the usual factor of 10
between water equivalent and snow depth.
The
following adjustments, however, are considered:
Modification
of the model “snow” type
There
are 2 exceptions where the "Bourgouin" type
will be modified by the program which produces the “Snow and snow squall”
chart:
1-
In
this sector, the resolution of the model topography is such that the terrain
elevation in the valleys is estimated “too high”. This bias results in model surface
temperatures which are, for the most part, too cold, and precipitation types
have a decided bias toward solid precipitation.
The result is that the regional model often forecasts snow in the
valleys where rain would more reasonably be expected.
Empirical
experience leads to the application of the following rule in this sector:
- where model terrain is below about 1600 metres
in British Colombia and southern Yukon, i.e. in the "white" area of
the chart below and then also including eastern pacific and northwestern corner
of the United States:
- if
the model forecasts snow ("Bourgouin"
type), and
- if
the 1000-850 hPa thickness is forecast above 131 dam,
then
the program will change the “snow” type to “rain” at the grid point and
projection time considered.
2- Snow
squalls
The
manner in which snow squalls are diagnosed by the program is explained below in
section (b). It should be stated here,
however, that snow squalls are obtained when the model forecasts type “snow” at
a given location, under the conditions of low level instability described
below. In this case the program
artificially changes the “snow” type to “snow squall” type for the grid point
and projection time under consideration.
As
such, the program which generates the forecast snow accumulation charts takes
into account the modifications of the precipitation types described above, and
does not add the QPF for the 3-hourly intervals where these modifications have
taken place.
Modification of the 10 times
equivalence factor
The
10 times equivalence factor between model QPF and snow accumulation is used
except in the following case:
- if
the model forecasts snow over a 3 hour period, and
- if
the average forecast 850-700 hPa thickness is above
154 dam for this time interval,
then
the program will apply a rain-snow factor calculated according to an algorithm
developed by B. Murphy (Ontario), based on average 1000 to 700 hPa thicknesses for the 3 hour period.
In
such cases, the result will be a factor less than 10, thus lowering the total
snow accumulations.
The
algorithm is as follows:
RATIO
= QSF / QPF (= 10 ... generally)
where... QSF = "Quantity of Snow Forecast"
QPF = "Quantity of Precipitation
Forecast"
RATIO = 10 x [ (-0.1057 x DZ_moy) + 30.6 ]
(Murphy)
where...
DZ_moy = DZ(1000-700) in dam
(averaged
over 3 hours)
DZ(1000-700) = 1000-700 hPa thickness
b) Snow
squalls
Two
types of snow squalls are defined:
- snow
squalls triggered by warm air flowing over relatively warmer bodies of water,
such as the Great Lakes or the
- snow
squalls triggered by an intense cold front moving through an unstable airmass.
In
fact, what is being looked for, in general, is to forecast the potential
occurrence of the following meteorological phenomenon:
Heavy snow showers reducing visibility to near zero...
- visibility expected to drop to less than 1/2 mi;
- accompanied
or not by blowing snow;
-* occurring suddenly and being of short duration
(especially for frontal squalls);
-* may last for a much longer time in the case of
lake/water effect squalls.
The
forecast is thus independent of the duration of the phenomena...
* ANY OCCURRENCE (ONE OR MORE)
OF SUCH SNOW SHOWERS EXPECTED DURING DE FORECAST PERIOD OF THE CHART SHOULD
LEAD TO A FORECAST AREA OF SNOW SQUALLS.
N.B. THERE WILL BE NO FORECASTS OF SNOW
ACCUMULATIONS ASSOCIATED WITH SNOW SQUALLS.
In
all cases, snow squalls are produced when the surface temperature is near or
below zero Celsius and, obviously, the temperature is below zero in the whole
profile above the surface. To assure
this, the following preliminary conditions are imposed upon the snow squall
program:
- surface temperature <=
2°C
- 1000-850 hPa thickness < 129
dam
- forecast precipitation
type = SNOW
The
last condition above, that the forecast precipitation type be snow, also
assures, in indirect fashion, that the humidity in the forecast profile is
sufficient to produce precipitation.
However,
the GEM regional model with 15 km resolution is more easily showing
precipitation than the previous 24 km resolution model when it is relatively
dry at the surface. So the following condition has been added:
- surface dew point depression <= 5°C
In
addition to these preliminary conditions, conditions of one of the following
three categories must be forecast:
1- Squalls
- water bodies
Squalls
caused by the circulation of cold air over bodies of relatively warm water are
mainly related to the following parameters:
-
low-level instability;
-
low-level humidity.
As
indicated above, for the purpose of the program used, low-level humidity is
judged to be sufficient if the model forecasts precipitation (in the form of
snow) and that the surface dew point depression (T-Td) is smaller than or equal
to 5°C.
For
the low-level instability, the following instability criteria are used:
· [
DZ(850-700) - DZ(1000-850) ] <= 20 dam
where... DZ(850-700) = 850-700 hPa
thickness
DZ(1000-850)
= 1000-850 hPa thickness
This
criteria assures a certain level of instability in the 1000-850 hPa layer with respect to the 850-700 hPa
layer.
· (Tsfc - T850) >= 10°C
where... Tsfc = surface
temperature
T850
= 850 hPa temperature
This
criteria assures that the temperature profile in the lower layer tends toward
dry adiabatic.
2- Frontal
squalls
In
addition to the low-level instability and humidity criteria, frontal squalls
require lift caused by the passage of a vigourous
cold front.
This
condition has been related to low-level convergence, normally associated with
an isobaric trough. For the purposes of
the program, a minimal value of 1000 hPa geostrophic vorticity is required
to satisfy this condition.
As
well as the preliminary conditions described above, the following conditions
should be met:
· (Tsfc – T850) >= 5°C
· [ DZ(850-700) - DZ(1000-850) ] <= 19 dam
· QG-1000 >= 10 x 10E-5
/sec
OR
· (Tsfc – T850) >= 5°C
· [ DZ(850-700) - DZ(1000-850) ] <= 21 dam
· QG-1000 >= 25 x 10E-5 /sec
where... DZ(850-700) = 850-700 hPa
thickness
DZ(1000-850)
= 1000-850 hPa thickness
QG-1000 = 1000 hPa
geostrophic
vorticity
3- Squalls
due to strong winds
In
certain cases where the low level instability is high, and the 850 hPa winds are quite strong, a snow shower occurring at the
same time as a low level downdraft could result in a reduced visibility. What is required is a profile tending toward
dry adiabatic between the surface and 850 hPa, under
conditions of strong winds at the top of this layer.
The
program thus finally looks for the following conditions to justify snow squall
potential:
- (Tsfc - T850) >=
10°C
where... Tsfc = surface temperature
T850
= 850 hPa temperature
- UV-850 >= 40 kts
where... UV-850 = 850 hPa wind
speed
=====================================================
=====================================================
2- FREEZING RAIN/DRIZZLE - HEAVY
RAINFALL
ISSUE
TIMES
Charts
issued at 0400Z- based on GEM regional 00Z
- 12-36h period - Valid from 12Z/d
to 12Z/d+1
- 12-48h period - Valid from 12Z/d
to 00Z/d+2
- 24-48h period - Valid from 00Z/d+1 to 00Z/d+2
Charts
issued at 1600Z- based on GEM regional 12Z
- 12-36h period - Valid from 00Z/d+1 to 00Z/d+2
- 12-48h period - Valid from 00Z/d+1 to 12Z/d+2
- 24-48h period - Valid from 12Z/d+1 to 12Z/d+2
DESCRIPTION
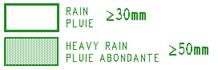
a) Rain
amounts
Areas
where amounts of 30 mm or more
are forecast during the valid period of the chart are displayed.
Areas
of 30 and 50 mm are represented as follows:
B) Freezing
rain
Areas
of forecast freezing rain in the amounts of 2 mm or more, or for a duration of 3 hours or more are represented as follows:
![]()
C) Freezing
drizzle
Areas
of forecast freezing drizzle for a duration of 6 hours or more are represented as follows:
![]()
DETERMINATION
OF THE AREAS
a) Rain
amounts
Amounts
of rain are generated from the regional model QPF and from the precipitation
type “rain”, from the “Bourgouin” diagnostic scheme.
This diagnostic, done three hourly through the forecast period, is the one used
operationally to generate precipitation types as found on the 4-panel “pressure
and pressure tendency” charts.
In
this way, rain amounts forecast for a given period of time are obtained as
follows:
- the precipitation type forecast by
the model ("Bourgouin” type) is examined at the
two extremities of each 3 hour interval in the period under consideration. If it is possible to deduce that there will
be no change of precipitation type during a given 3-hour interval, and only
rain is expected during this period, then the QPF for this interval is
considered to be “rain”. For this to
occur, one of the following combinations of types must be forecast at the extremities
of the 3-hour interval:
T T+3h
Nil Rain
Rain Rain
Rain
Nil
where
... Nil = no precipitation
- the
QPFs for the intervals where the above combinations
of types are encountered during the integration period under consideration
(12-36h, 12-48h, 24-48h) are thus added up, 3 hour period by 3 hour period. The
forecast rain QPF is thus obtained for the entire period.
It
is understood that if “snow” or "freezing rain" type was modified to
“rain” type over British Columbia or southern Yukon due to the considerations
in section (1a-1) above or (2-b) below, then the rain obtained is
added by the program within the rain QPF.
b) Freezing
rain
As
shown in the above (2-b) description of the charts, 2 criteria are
considered when generating a freezing rain area on one of the forecast charts
(12-36h, 12-48h, 24-48h):
-
a forecast amount of 2 mm or more;
-
a duration of 3 hours or more.
Occurrence
of freezing rain at 3 hours intervals is looked for as follows through a given
forecast period (12-36h, 12-48h, 24-48h): for a given prognostic time
"T", freezing rain is said to be forecast if one of the two following
conditions is encountered:
-
freezing rain is forecast by the diagnostic
"Bourgouin"
scheme ("ZR" variable in
"regdiag");
-
freezing rain amount of 0.5 mm or more is
forecast by the pronostic
variable "FR" of the
model for the 3 hours period ending up at
time
"T".
From
the above diagnostic, freezing rain amount is obtained by adding the amounts
given by the "FR" variable for each 3 hours period ending up at time
"T" of a positive freezing rain diagnostic through a forecast period.
For
the duration criteria, a minimum duration of three hours of freezing rain is
said to be forecast if the above diagnostic is positive at both ends of any 3
hours interval within the considered forecast period (12-36h, 12-48h, 24-48h),
by example:
T T+3h
FZRA FZRA
Modification
of the above freezing rain diagnostic
However,
in some cases where it seems justified to do it, the above freezing rain
diagnostic can be artificially changed to rain of freezing drizzle by the
program.
1-
Modification of FZRA to RA – BC +
In
this sector, the resolution of the model topography is such that the terrain
elevation in the valleys is estimated “too high”. This bias results in model surface
temperatures which are, for the most part, too cold, and precipitation types
have a decided bias toward "solid" or "freezing"
precipitation. The result is that the
regional model sometimes forecasts freezing rain in the valleys where rain would
more reasonably be expected.
Then,
similarly as for the modification of snow to rain in this sector, the following
rule is applied:
- where model terrain is below about 1600 metres
in British Colombia and southern Yukon, i.e. in the "white" area of
the chart below and then also including eastern pacific and northwestern corner
of the United States:
- if
the model forecasts freezing rain (according to the above described diagnostic),
and
- if
the 1000-850 hPa thickness is forecast above 131 dam,
then
the program will change the “freezing rain” type to “rain” at the grid point
and projection time considered.
2-
Modification of FZRA to FZDZ - anywhere
For any diagnostic of FZRA described above, it
is verified whether the model also forecasts a nose of warm air, i.e.
temperatures above 0°C in the 850-700 hPa
layer, according to the partial thicknesses technique.
If not, the “FZRA” so forecast is mainly associated
with an above freezing layer only at low levels, i.e. in the 1000-850 hPa layer. It is
then artificially converted to type “FZDZ”, freezing drizzle, at the grid point
and projection time under consideration.
The rule applied is the following:
- if
initial type forecast = FZRA, and
- DZ(850-700) < 154
dam
then resultant type = FZDZ.
One ends up with forecasts of "FZDZ"
and "FZRA", which the chart production program considers separately
to produce fields of potential freezing drizzle and freezing rain,
respectively.
c) Freezing
drizzle
For
a freezing drizzle area to show up, only a duration criterion is consedered. There is no amount criterion as for freezing
rain areas.
So
the criterion for a freezing drizzle area is:
-
a duration of 6 hours or more.
A
6 hour period of FZDZ is obtained if FZDZ is diagnosed for at least 2 complete
3 hours intervals for a given forecast period (12-36h, 12-48h, 24-48h), by
example:
T T+3h T+6h
ZL ZL ZL
T T+3h T+6h T+9h T+12h
ZL ZL Nil ZL ZL
=====================================================
=====================================================
3- BLOWING SNOW / BLIZZARD
DESCRIPTION
a) Blizzard
Areas
where blizzard or near blizzard conditions are forecast during de valid period
of the chart are displayed.
Areas
are represented as follows:
b) Snow and blowing snow (S/BS)
Areas
where blowing snow associated with a snowfall is forecast during the valid
period of the chart are displayed as S/BS (snow and blowing snow) or marginal
S/BS areas.
Areas
are represented as follows:

In
both cases above, we want indeed to depict situations where blowing snow is reducing visibility to 1 km (0.5 mile) or
less for 6 hours or more during the valid period of a chart. In the case of
blizzard, no snowfall is necessarily occurring. A mask has been designed on the
grid used by the program to delimit usual or known areas where blizzard
conditions are expected to show up and these conditions are looked for only in
these areas (see chart showing mask below).
It
is to be noted that, if S/BS conditions are depicted in delineated blizzard
areas according to the mask, then these S/BS conditions will show up as
"blizzard" conditions in these sectors. This has been done to prevent
overlapping of blizzard and S/BS areas on the forecast chart, as both represent
anyway a similar event, namely blowing snow reduding
visibility to 1 km or less. Thus, in these sectors, blizzard or S/BS conditions
will show up as brown areas on the forecast charts.
Elsewhere,
namely outside of the delineated areas of the mask, S/BS conditions will be
represented, as indicated on the legend of the chart, by orange areas. And
blizzard conditions are not depicted in these sectors, so no overlapping will
show up.
DÉTERMINATION
OF THE AREAS
Duration
In
both cases, "blizzard" or "snow and blowing snow (S/BS)",
we look for events that last for at least 6 hours. This is done as follows:
- we
first verify if criteria described below for depicting "blizzard" and
"S/BS" conditions are met at 3 hours time steps of the forecast
period of the regional model (Gemreg-15 km) from T+6h to T+48h;
- then
a period of 6 hours or more of "blizzard" or "S/BS" is
depicted if the criteria are met at each end or any 6 hours period within the
valid period of the chart.
By
example, for the 12-36h forecast period (T+12h to T+36h), a miminum
6 hours period is depicted in any of the following situations:
-
criteria met at T+12h and T+18h
-
criteria met at T+15h and T+21h
-
criteria met at T+18h and T+24h
-
criteria met at T+21h and T+27h
-
criteria met at T+24h and T+30h
-
criteria met at T+27h and T+33h
-
criteria met at T+30h and T+36h
We
do it this way in view of the intermittent nature of the phenomenon and also to
"give a chance" to the model. We are thus preventing to request that
the criteria be met a 3 consecutive time steps. It would be more restrictive,
for example for the T+18h to T+24h period, to request that the criteria be met
at T+18h, T+21h and T+24h instead or requesting that they be met only at T+18h and
T+24h as we indeed do.
a) Blizzard
For
depicting potential blizzard conditions, we request a minimum snow depth on the
ground, negative or 0ºC temperatures and a minimum wind velocity. It is not
necessary that snow be falling, but if there is precipitation, it must not be
liquid.
So
the preliminary conditions are the following:
-
Snow on the ground >= 5 cm
-
Tsfc = 0ºC
-
Precipitation: NIL or Snow or Ice pellets
For
the wind conditions, the minimum thresholds are dependent upon local effects and
topography. These thresholds are thus different from one sector to the other of
the mask delineating areas where blizzard conditions are depicted.
The
map below shows the areas delineated by the mask and where blizzard conditions
are mainly observed. Blizzard conditions will be forecast only in these
sectors.
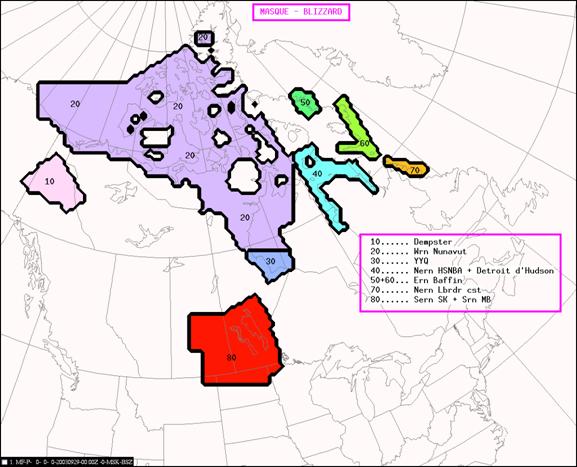
We
have grouped together in 5 regions the sectors showing up on the map:
10-
Dempster: north of
highway
toward WRR (
20-
WRN
+
northwestern
+
southwestern
30+40-
Churchill (MB)
+
northeastern
+
+
western
+
southwestern
50+60+70
+ northeastern
80- Southeastern
+ southern
The
critiria used to depict wind velocity are based on
the following fields:
-
Vgisal... modulus
of the vectorial sum of the geostrophic and isallobaric winds
-
MaxWin...
low levels max winds
-
UV (0.995)... model wind velocity at
eta level 0.995
- Ugeos... "x" component
of the geostrophic wind following the grid used, this orientation
being mainly "east-west" in the area where this parameter is used.
The
thresholds values below are "empirical" and have been mainly
determined by experience and verification, and also by adjustment of the values
for specific events.
Near Blizzard
- Région 10: Vgisal >=
90 kts
Ugeos <= 0 kt (easterly wind)
-
Région
20: Vgisal >=
30 kts
UV(0.995) >= 15 kts
-
Région
30+40: Vgisal >=
50 kts
-
Région
50+60+70: Vgisal >= 40 kts
MaxWin >= 40 kts
-
Région
80: Vgisal >=
60 kts
Blizzard
- Région 10: Vgisal >=
110 kts
Ugeos <= 0 kt (easterly wind)
-
Région
20: Vgisal >= 40 kts
UV(0.995) >= 15 kts
-
Région
30+40: Vgisal >=
60 kts
-
Région
50+60+70: Vgisal >= 50 kts
MaxWin >= 50 kts
-
Région
80: Vgisal >=
80 kts
It
is to be noted that the Ugeos parameter is only used
for the Dempster area (region 10). We need to make
sure that the wind is blowing easterly in this area to prevent wrong blizzard
diagnostics. Blizzard mainly shows up in this area with easterly winds north of
an "east-west" trough central
b) Snow
and blowind snow (S/BS)
Cases
of blowing snow within snow storms are indeed a subset of the blizzard cases
described above. However a significant difference for depiction is showing up
mainly for the minimum wind velocity requested. Visibility being reduced not
only by blowing snow but also by the snowfall, it is then easier to obtain low
visibilities than for "pure" blizzard where visibility is only
reduced by the snow on the ground being blown up. As a result, the criteria for
winds are somewhat relaxed for S/BS events compared to blizzard events.
On
the other hand, S/BS events can of course show up anywhere and not only in the
"mask" areas where we limit blizzard depiction. The only restriction
in the program is for mountainous areas where depiction is not performed where
model terrain elevation is 700 meters or higher (see chart below). Wind
conditions are quite variable in mountainous areas where observations are also
quite sparse.

Preliminary
conditions for depiction of S/BS events are the following:
-
Tsfc = 0ºC
-
Precipitation type = Snow
-
Vgisal = x
where x = f(sector)
We
then request that the model forecasts snow where and when we perform a
diagnostic as we are looking for a "snow and blowing snow" event. On
the other hand, temperature must be forecast to be 0ºC or lower to ensure for "solid" precipitation and to
allow for snow to be more easily blown up.
The
wind criteria is based on one field only for S/BS depiction, namely the "Vgisal" field which represents the modulus of the vectorial sum of the geostrophic
and isallobaric winds. The thresholds are as follows
for the different forecast sectors:
Marginal S/BS
-
Région 10: Vgisal >= 70 kts
- Région 20: Vgisal >=
30 kts
- Région 30+40: Vgisal >=
40 kts
- Région 50+60+70: Vgisal >= 40 kts
- Région 80: Vgisal >=
50 kts
- Elsewhere (model terrain < 700 m):
Vgisal
>= 70 kts
S/BS
-
Région 10: Vgisal >= 90 kts
- Région 20: Vgisal >=
40 kts
- Région 30+40: Vgisal >=
50 kts
- Région 50+60+70: Vgisal >= 50 kts
- Région 80: Vgisal >=
70 kts
- Elsewhere (model terrain < 700 m):
Vgisal
>= 90 kts
=====================================================
=====================================================
5- WIND CHILL – SEVERE WINDS
DESCRIPTION
a) Wind chill
Areas
where wind chill temperatures of -35°C or less are forecast for a duration of
at least 3 hours during the valid period of the chart are displayed.
Areas
of different WCT (Wind Chill Temperature) are represented as follows:
b) Severe
Winds
Areas
where winds of 90 km/h or more, regular or gust, are forecast during the valid
period of the chart are displayed.
Areas
are represented as follows:
DETERMINATION
OF THE AREAS
a) Wind
chill
Wind
chill is computed with the Osczevski-Bluestein
formulation, which is used to produce the operational "difax"
charts of wind chill temperatures within the CMC winter severe weather package.
Values
of WCT (Wind Chill Temperature) showing up on these charts are computed only
when the forecast surface temperature (Tsfc) is less
than or equal to 0°C and the forecast surface wind (Vsfc)
is of 5 km/h or more. Otherwise, values of WCT showing up are simply the
forecast surface temperatures.
So
the WCT values are obtained as follows:
IF Tsfc = 0°C
AND Vsfc >=
5 km/h
Then
WCT computed with Osczevski-Bluestein equation
ELSE
WCT
= T°
On
the "IWEB" charts described here, areas of WCT are only displayed for
values of -35°C or less and with expected duration of 3 hours or more during the
valid period of the chart. The 3 hours duration criteria is met if a looked for
WCT value is forecast at both ends of any 3 hours period within the valid
period of the chart.
By
example, for the 12-36h forecast period (T+12h to T+36h), a minimum 3 hours
duration is depicted in any of the following situations:
-
WCT criteria met at T+12h and T+15h
-
WCT criteria met at T+15h and T+18h
-
WCT criteria met at T+18h and T+21h
-
WCT criteria met at T+21h and T+24h
-
WCT criteria met at T+24h and T+27h
-
WCT criteria met at T+27h and T+30h
-
WCT criteria met at T+30h and T+33h
-
WCT criteria met at T+33h and T+36h
b) Severe
winds
The
following fields are used for depiction of severe winds:
-
UV (0.995)... model wind velocity at
eta level 0.995
- Vgisal...
modulus of the vectorial sum of the
geostrophic and isallobaric
winds
-
Visal... modulus of the isallobaric
wind
- MaxWin...
low levels max winds
- Tsfc–T850... difference between surface temperature and 850 mb
temperature
- Difdz...
DZ(850-700)-DZ(1000-850)
- WW_850... 850 mb
vertical velocity
Difference of partial
thicknesses:
Thickness(850-700) –
Thickness(1000-850)
- UV_850... model wind velocity at level 850 mb
Wind
velocity being dependant upon local effects and topography, we then need to
apply a mask on the computational grid to allow for different criteria to be
applied as a function of the identified areas. These areas are showing up on
the map below.
Some
of the criteria described thereafter are thus applied as a function of these
defined areas but it is to be noted that some other criteria are “universal”,
i.e. they do apply as well within and outside of the defined areas by the mask.
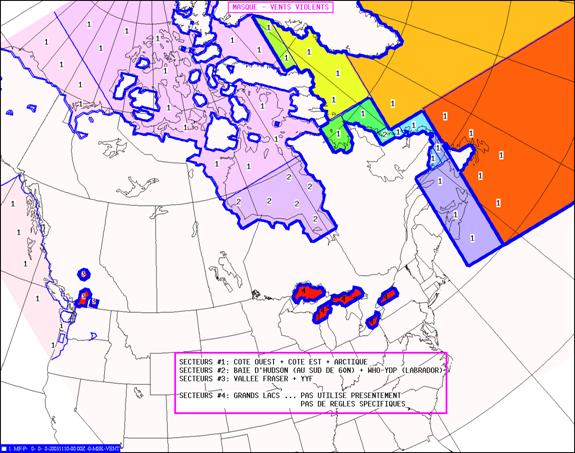
Sectors
#1: west coast + east coast + arctic
Sectors
#2:
WHO + YDP (sector of Hopedale + Nain)
Sectors
#3: Fraser valley (YHE-WLY-YWL)
(Hope-Lytton-Williams
lake)
YYF (
Sectors
#4:
This defined area of the mask
is not currently
being
used. There is then no specific rules for
this
area where “universal” criteria are thus the
ones that do apply.
As
for the blizzard and S/BS criteria, the threshold values indicated below for
the severe winds criteria are "empirical" and have been mainly
determined by experience and verification, and also by adjustment of the values
for specific events.
The
criteria are described below following their order of priority, from the one
with the highest priority (criteria #1) to the one with the lowest priority
(criteria #7).
The
program checks for severe winds potential in the following way: for a given
grid point and projection time, the program checks if the criteria described
below are met, from criterion #1 down to criterion #7. As soon as one criterion
is met and then that a positive diagnostic for severe wind is done, the program
stops checking.
Such
a verification of the criteria is performed for each grid point at 3 hours
intervals of prognostic times, namely from T+3h to T+48h.
For
a severe wind to be forecast at a given grid point for a given forecast period
(12-36h, 12-48h, 24-48h), it is sufficient that a positive severe wind diagnostic
be done for this grid point for any of the prognostic times of this period.
If
a positive severe wind diagnostic results for more than one prognostic time
within the forecast period at this grid point, then the criterion said to be
met for forecasting severe wind at this grid point for the considered period is
the one with the highest priority met during the period.
It
is finally to be noted that a few criteria only apply in areas where model (Gemreg-15km)
terrain height is less than 700 meters. The chart below enhances in red the
areas where the model terrain height is 700 meters or more.
Criteria (from de highest to the lowest priority)
1- Model wind – applies anywhere
UV (0.995) >= 40 kts
2- Intense low – applies
where terrain height < 700 m
Vgisal >= 125 kts
MaxWin >= 50 kts
3- Isallobaric winds – applies where
terrain height <
700 m
Vgisal >= 125 kts
Visal >=
50 kts
4- Instability – applies anywhere
UV (0.995) >= 30 kts
AND
Tsfc–T850 >= 10°C AND UV_850 >= 50 kts
OR
Maxwin >=
40 kts AND
Difdz <= 19dam AND
Tsfc–T850 >= 9°C
OR
Vgisal >=
50 kts AND Maxwin >= 50 kts AND
Difdz <= 20 dam AND terrain < 700 m
5- West coast – East coast – Arctic
(sectors 1 of the above chart)
Vgisal >= 50 kts AND MaxWin >= 50 kts
6- Southern Hudson bay + WHO/YDP
(sectors 2 of the above chart)
Vgisal >= 75 kts AND MaxWin >= 50 kts
Fraser valley + CYYF
(sectors
3 of the above chart)
Vgisal >= 75 kts AND MaxWin >= 60 kts
7- Katababic wind or
subsidence + instability
(applies anywhere)
UV (0.995) ≥ 15 kts
AND
Vgisal >= 75 kts AND MaxWin >= 50 kts AND
WW_850 <= -0.8 pa/s
OR
Vgisal >=
100 kts AND
MaxWin >= 40 kts AND
WW_850 <= -0.8 pa/s
OR
Vgisal >= 50 kts AND MaxWin >= 60 kts AND
WW_850 <=
-0.6 pa/s AND Difdz <= 21 dam
=====================================================
=====================================================