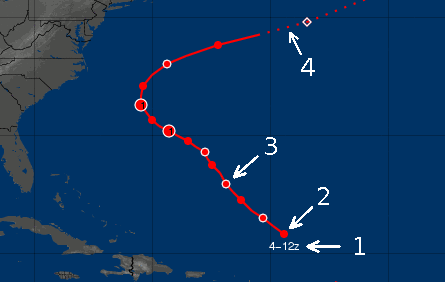
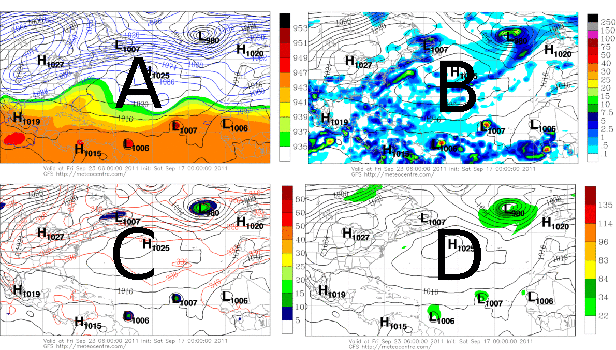
The tropical cyclone tracking algorithm uses the same core than the
extra-tropical pressure-based tracking algorithm. In order to identify cyclones with tropical characteristics, 4 additional parameters are considered here:
- 850-hPa relative vorticity filtered with a Cressman filter using a 300-km radius
- 250-850 hPa thickness
- Surface (10 m) wind speed
- Low level baroclinicity (noted B) measured in terms of asymetry of the 600-900 hPa thickness field. The definition of B employed here follows Sinclair, M. R., 2004: Extratropical Transition of Southwest Pacific Tropical Cyclones. Part II: Midlatitude Circulation Characterisitcs, Mon. Wea. Rev., 132, p. 2149.
To be defined as a tropical cyclone, a low pressure centre must meet the following 4 criteria:
- Possess a maximum of 850-hPa relative vorticity greater than +2,5x10⁻⁵ s-1 whitin a radius of 150 km.
- Possess a maximum of 250-850 hPa thickness greater than 935 dam whitin a radius of 150 km (indicating a deep warm core structure).
- Generates a surface (10 m) wind speed greater than 22 knots within a radius of 225 km.
- Evolve in a barotropic or weakly baroclinic environment, defined here by a value of B lower than 25 m.
A track is started only when all the above criteria are met. The classification of tropical cyclones plotted on maps follow the Safir-Simpson scale based on surface wind speed, i.e.:
- Tropical Depression : V10m < 34 knots
- Tropical Storm : 34 < V10m < 64 knots
- Hurricane : V10m > 64 knots
When a cyclone not longer meets all the (4) criteria, it is classified as a post-tropical cyclone. The cyclone will be tagged as "Extratropical" if evoling in a baroclinic environment (B > 25m) or as "Remnant" if still in a barotropic environment. Note that a cyclone will still be tagged as being extratropical even if the value of B decreases later below 25 m (e.g. due to an occlusion of the cyclone).


