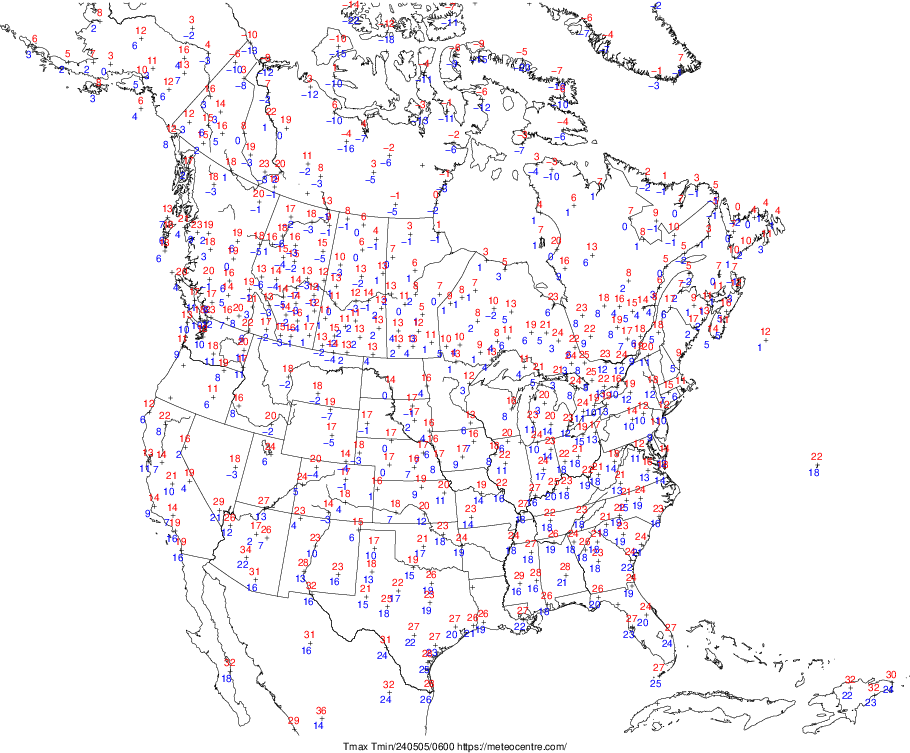
Surface observations / SYNOP Reports / North America
Regions: North America | Quebec | Canada | USA | Europe | France | UK
Legend
- Red (up): Maximum temperature (°C) in the last 24h
- Blue (down): Minimum temperature (°C) in the last 24h
Decoding time stamp example:
Min-max Plot/250704/1400
250704/1400: year=2025; month=07 (July); day=04; 1400=14:00 UTC
Data available each day at around 07:30 UTC.

