Classement

Contenu populaire
Affichage du contenu avec la meilleure réputation le 2016-07-11 dans toutes les zones
-
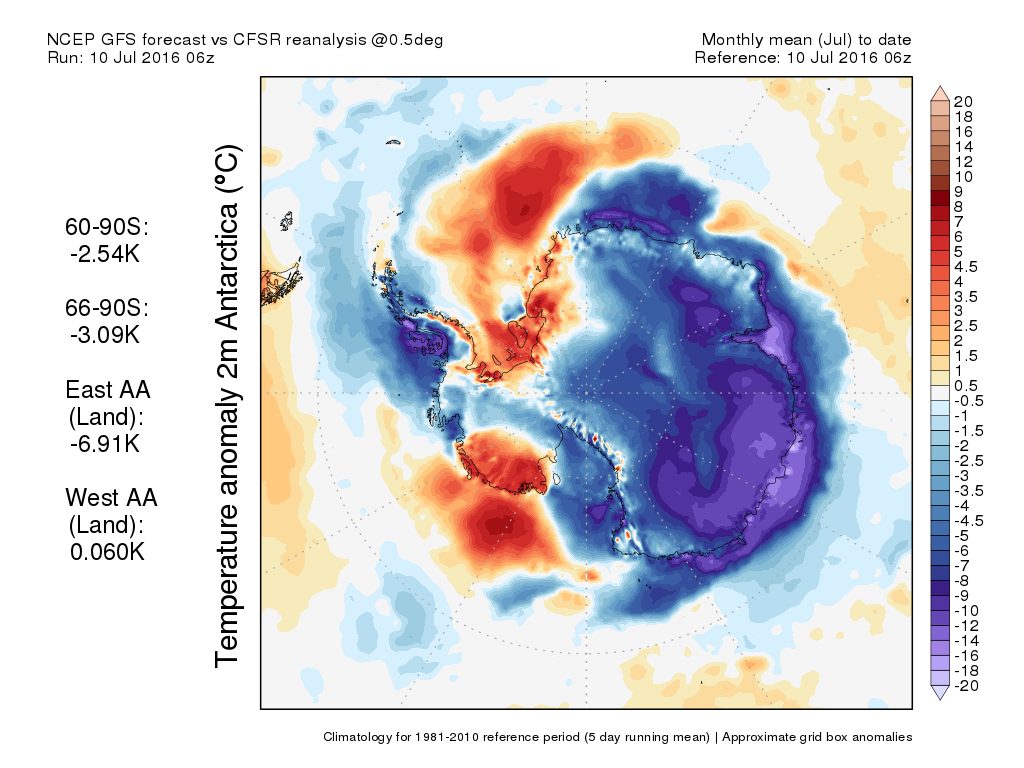
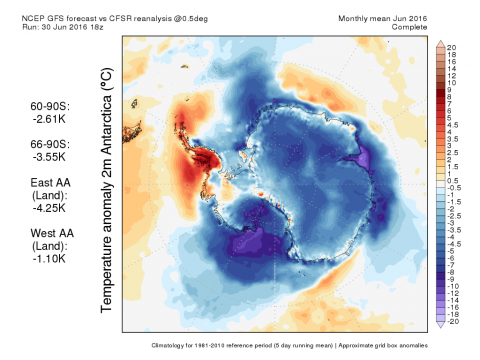
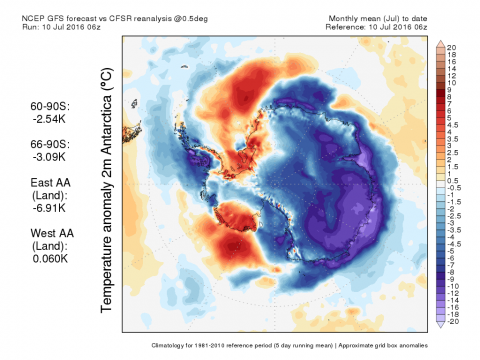
Allo Christian !!! La carte que j'ai mise est une prévision du modèle Canadien ( j'pense bien que tu le sais ) jusqu'au 14 juillet. C'est quand même pas très loin de la vérité par-contre. Mais pour juin et juillet jusqu'à maintenant, c'est ceci... Et pour ton interrogation sur le calcul des données la-bas (des anomalies ) et bien je crois que tu trouveras réponse ici. Both version of the global forecast are complemented with the average anomaly value over the entire domain. They are computed using the intrinsic "aaVe" average function in GrADS. Since the circumpolar Antarctic vortex (the southern hemispheric equivalent to the polar Jetstream in the northern hemisphere) cuts the Antarctic circulation off the atmospheric circulation to its north, it is treated separately to reduce the noise in the global anomaly value. You may think of the Antarctic circulation as a climate of its own, which is disconnected from the rest of the world. It features all sort of extremes, not only in absolute temperature values, but also in terms of temperature anomaly, which renders the identification of any climate change related temperature trend extremely difficult. The highly variable annual sea ice behaviour only adds to the complexity. By the way, from a physical perspective, the Antarctic sea ice is fundamentally different from the Arctic sea ice. While the first tends to melt almost completely every year (annual ice), the latter consists of multi-year sea ice that has (up to now) never (in the Holocene) melted completely. One must not compare the two polar ice caps as distinctively different processes are involved with regard to the sea ice dynamics. Opposite trends in sea ice area and/or extent are all but surprising. Thus, one may use the global average anomaly without Antarctica to get a more reliable estimate of the current truly climate-related temperature anomaly. Please note that at times the GrADS post-processing average function leads to inconsistent numbers with respect to the global estimate versus the arithmetic mean estimate of the Antarctic and the remainder of the globe. I am not entirely sure why this is happening, but the computed values are generally plausible as longer-term validation has shown. Note also that the 60-90°S anomaly for the Antarctic subdomain is different from that in the global product due to the adjustments made to better compare the global average with the instrumental data
 1 point