

iceberg
-
Compteur de contenus
1 349 -
Inscription
-
Dernière visite
-
Jours gagnés
47
Type de contenu
Profils
Forums
Events
Gallery
Tout ce qui a été posté par iceberg
-
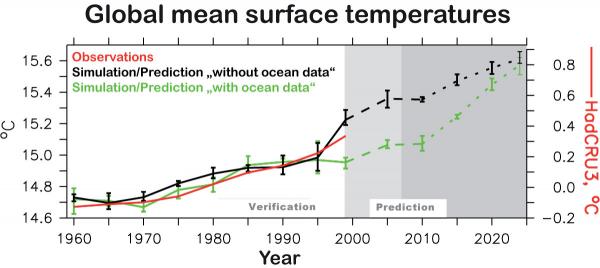
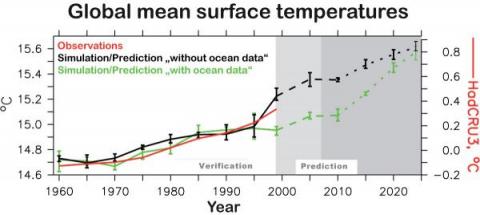
DELAY IN GLOBAL WARMING !! A new study by German researchers indicates that there will be a respite from global warming through the year 2015 before worldwide temperatures resume the upward trend predicted by most of the worlds climate experts. Climatologists from the Max Planck Institute for Meteorology in Hamburg and the Leibniz Institute of Marine Sciences in Kiel say that a natural variation in ocean currents will cancel out the effects of manmade greenhouse gases. They made that prediction based on what they believe is an impending change in the Gulf Stream the ocean conveyor belt that carries warm surface waters from the tropical Atlantic to the northern Atlantic before returning cooler water southward in the oceans deep. Northern Europe and North America should benefit the most from the delayed warming. Just to make things clear, we are not stating that anthropogenic (man-made) climate change wont be as bad as previously thought, said professor Mojib Latif. What we are saying is that on top of the warming trend, there is a long-periodic oscillation that will probably lead to a lower temperature increase than we would expect from the current trend during the next years. FROM API
-
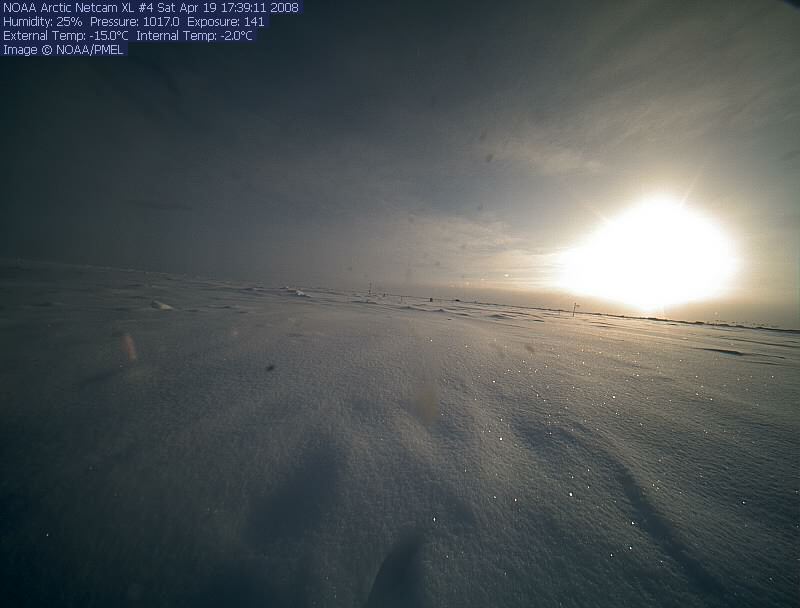
noaa 15

-
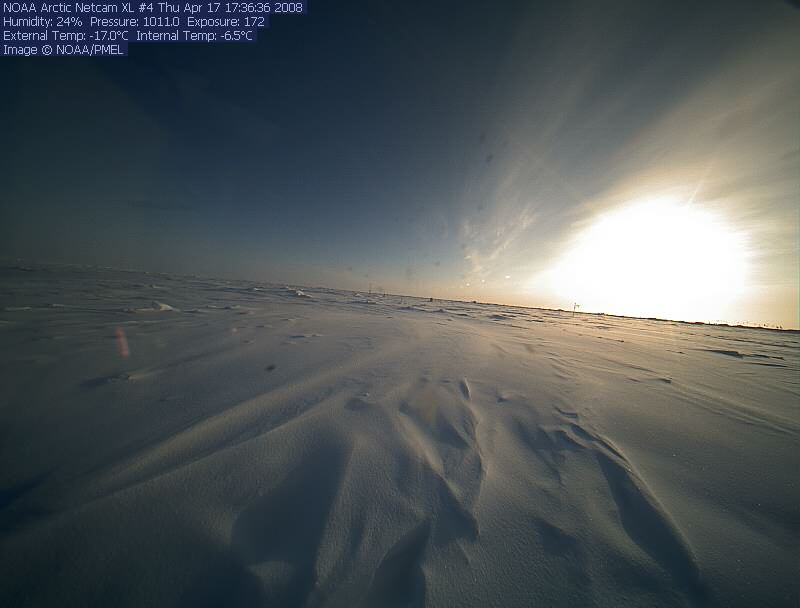
noaa 13
-
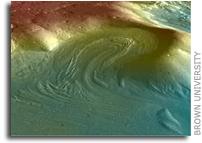
Glaciers Reveal Martian Climate Has Been Recently Active Brown University researchers have found compelling evidence of thick, recurring glaciers on Mars, a discovery that suggests that the Red Planet's climate was much more dynamic than previously believed - and could change again. Results are published on the cover of Geology magazine. The prevailing thinking is that Mars is a planet whose active climate has been confined to the distant past. About 3.5 billion years ago, the Red Planet had extensive flowing water and then fell quiet - deadly quiet. It didn't seem the climate had changed much since. Now, in a research article that graces the May cover of Geology, scientists at Brown University think Mars' climate has been much more dynamic than previously believed. After examining stunning high-resolution images taken last year by the Mars Reconnaissance Orbiter, the researchers have documented for the first time that ice packs at least 1 kilometer (0.6 miles) thick and perhaps 2.5 kilometers (1.6 miles) thick existed along Mars' mid-latitude belt as recently as 100 million years ago. In addition, the team believes other images tell them that glaciers flowed in localized areas in the last 10 to 100 million years - akin to the day before yesterday in Mars' geological timeline. This evidence of recent activity means the Martian climate may change again and could bolster speculation about whether the Red Planet can, or did, support life. "We've gone from seeing Mars as a dead planet for three-plus billion years to one that has been alive in recent times," said Jay Dickson, a research analyst in the Department of Geological Sciences at Brown and lead author of the Geology paper. "[The finding] has changed our perspective from a planet that has been dry and dead to one that is icy and active." In fact, Dickson and his co-authors, James Head, a planetary geologist and the Louis and Elizabeth Scherck Distinguished Professor at Brown, and David Marchant, an associate professor in the Department of Earth Sciences at Boston University, believe the images show that Mars has gone through multiple Ice Ages - episodes in its recent past in which the planet's mid-latitudes were covered by glaciers that disappeared with changes in the Red Planet's obliquity, which changes the climate by altering the amount of sunlight falling on different areas. Dickson and the other researchers focused on an area called Protonilus Mensae-Coloe Fossae. The region is located in Mars's mid-latitude and is marked by splotches of mesas, massifs and steep-walled valleys that separate the lowlands in the north from the highlands in the south. The team looked in particular at a box canyon set in a low-lying plain. Images show the canyon has moraines - deposits of rocks that mark the limits of a glacier's advance or the path of its retreat. The rock deposit lines appear to show a glacier that flowed up the box canyon, which "physically cannot happen," Dickson said. Instead, the team deduced the ice in the surrounding plain grew higher than the canyon's walls and then flowed downward onto the top of the canyon, which had become the lowest point on the ice-laden terrain. The team calculated the ice pack must have been one kilometer thick by past measurements of height between the plain and the lip of the canyon. Based on the ice flow patterns, the ice pack could have reached 2.5 kilometers at peak thickness during a period known as the late Amazonian, the authors said. The finding could have implications for the life-on-Mars argument by strengthening the case for liquid water. Ice can melt two ways: by temperature or by pressure. As currently understood, the Martian climate is dominated by sublimation, the process by which solid substances are transformed directly to vapor. But ice packs can exert such strong pressure at the base to produce liquid water, which makes the thickness of past glaciers on its surface so intriguing. Dickson also looked at a lobe across the valley from the box canyon site. There, he saw a clear, semi-circular moraine that had spilled from an ancient tributary on to the surrounding plain. The lobe is superimposed on a past ice deposit and appears to be evidence of more recent glaciation. Although geologists can't date either event, the landscape appears to show at least two periods in which glaciation occurred, bolstering their theory that the Martian climate has undergone past Ice Ages. Read an online version of the paper. NASA and the National Science Foundation funded the work.
-
MARS WEATHER !!! BRR 25 APRIL 2008. Today... High winds will lift some scattered dust storms, otherwise mostly sunny. Dust storms may continue throughout the week, causing eye and skin irritation. South wind becoming East to 30 km/hr. Tonight...isolated evening dust then clearing. Lows in the upper -70s to lower -60s. Northwest wind 30 to 40 km/hr diminishing. Saturday...mostly sunny. Highs in the mid -40s. Northwest wind to 40 km/hr. Extended forecast... Sunday through Thursday...dry with a warming trend. Lows in the -60s. Highs in the lower to mid -30s. forecasts are provided by the Interplanetary Weather Service jaime cette prévisions de mars..... http://astro.sci.uop.edu/~harlow/weather/mars.html
-
WELLINGTON (AFP) - New Zealand's largest glacier is shrinking fast due to climate change and will eventually disappear altogether, scientists said Thursday. The 23-kilometre (14.3 mile) long glacier in the South Island's Southern Alps is likely to shrink at a rate of between 500 and 820 metres a year, said Martin Brook, a physical geography lecturer at Massey University. "In the last 10 years the glacier has receded a hell of a lot," Brook said on the university website. "It's just too warm for a glacier to be sustained at such a low altitude -- 730 metres above sea level -- so it melts rapidly and it is going to disappear altogether." The rapid melting has seen a lake seven kilometres long and two kilometres wide form at the base of the glacier. Thirty-five years ago, the lake did not exist. "The last major survey was in the 1990s and since then the glacier has retreated back 180 metres a year on average," Brook said. The lake at the foot of the glacier is speeding up the melting as more ice is submerged under the surface of the water. A study last year by the National Institute of Water and Atmospheric Research found the volume of ice in the Southern Alps had shrunk almost 11 percent in the past 30 years. More than 90 percent of this loss was due to the melting of the 12 largest glaciers in the mountain range due to rising temperatures, the university report said
-
WASHINGTON - Human beings may have had a brush with extinction 70,000 years ago, an extensive genetic study suggests. The human population at that time was reduced to small isolated groups in Africa, apparently because of drought, according to an analysis released Thursday. The report notes that a separate study by researchers at Stanford University estimated the number of early humans may have shrunk as low as 2,000 before numbers began to expand again in the early Stone Age. "This study illustrates the extraordinary power of genetics to reveal insights into some of the key events in our species' history," Spencer Wells, National Geographic Society explorer in residence, said in a statement. "Tiny bands of early humans, forced apart by harsh environmental conditions, coming back from the brink to reunite and populate the world. Truly an epic drama, written in our DNA." Wells is director of the Genographic Project, launched in 2005 to study anthropology using genetics. The report was published in the American Journal of Human Genetics. Previous studies using mitochondrial DNA which is passed down through mothers have traced modern humans to a single "mitochondrial Eve," who lived in Africa about 200,000 years ago. The migrations of humans out of Africa to populate the rest of the world appear to have begun about 60,000 years ago, but little has been known about humans between Eve and that dispersal. The new study looks at the mitochondrial DNA of the Khoi and San people in South Africa which appear to have diverged from other people between 90,000 and 150,000 years ago. The researchers led by Doron Behar of Rambam Medical Center in Haifa, Israel and Saharon Rosset of IBM T.J. Watson Research Center in Yorktown Heights, N.Y., and Tel Aviv University concluded that humans separated into small populations prior to the Stone Age, when they came back together and began to increase in numbers and spread to other areas. Eastern Africa experienced a series of severe droughts between 135,000 and 90,000 years ago and the researchers said this climatological shift may have contributed to the population changes, dividing into small, isolated groups which developed independently. Paleontologist Meave Leakey, a Genographic adviser, commented: "Who would have thought that as recently as 70,000 years ago, extremes of climate had reduced our population to such small numbers that we were on the very edge of extinction." Today more than 6.6 billion people inhabit the globe, according to the U.S. Census Bureau. The research was funded by the National Geographic Society, IBM, the Waitt Family Foundation, the Seaver Family Foundation, Family Tree DNA and Arizona Research Labs.
-
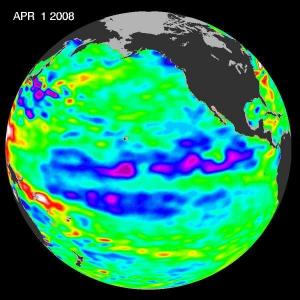
LA NINA !! (Apr. 22, 2008) Boosted by the influence of a larger climate event in the Pacific, one of the strongest La Niñas in many years is slowly weakening but continues to blanket the Pacific Ocean near the equator, as shown by new sea-level height data collected by the U.S.-French Jason oceanographic satellite. This La Niña, which has persisted for the past year, is indicated by the blue area in the center of the image along the equator. Blue indicates lower than normal sea level (cold water). The data were gathered in early April. The image also shows that this La Niña is occurring within the context of a larger climate event, the early stages of a cool phase of the basin-wide Pacific Decadal Oscillation. The Pacific Decadal Oscillation is a long-term fluctuation of the Pacific Ocean that waxes and wanes between cool and warm phases approximately every five to 20 years. In the cool phase, higher than normal sea-surface heights caused by warm water form a horseshoe pattern that connects the north, west and southern Pacific, with cool water in the middle. During most of the 1980s and 1990s, the Pacific was locked in the oscillation's warm phase, during which these warm and cool regions are reversed. A La Niña is essentially the opposite of an El Niño. During El Niño, trade winds weaken and warm water occupies the entire tropical Pacific Ocean. Heavy rains tied to the warm water move into the central Pacific Ocean and cause drought in Indonesia and Australia while altering the path of the atmospheric jet stream over North and South America. During La Niña, trade winds are stronger than normal. Cold water that usually sits along the coast of South America is pushed to the middle of the equatorial Pacific. A La Niña changes global weather patterns and is associated with less moisture in the air, and less rain along the coasts of North and South America. This multi-year Pacific Decadal Oscillation 'cool' trend can intensify La Niña or diminish El Niño impacts around the Pacific basin," said Bill Patzert, an oceanographer and climatologist at NASA's Jet Propulsion Laboratory, Pasadena, Calif. "The persistence of this large-scale pattern tells us there is much more than an isolated La Niña occurring in the Pacific Ocean." Sea surface temperature satellite data from the National Oceanic and Atmospheric Administration also clearly show a cool Pacific Decadal Oscillation pattern, as seen at: http://www.cdc.noaa.gov/map/images/sst/sst.anom.gif . The shift in the Pacific Decadal Oscillation, with its widespread Pacific Ocean temperature changes, will have significant implications for global climate. It can affect Pacific and Atlantic hurricane activity, droughts and flooding around the Pacific basin, marine ecosystems and global land temperature patterns. The comings and goings of El Niño, La Niña and the Pacific Decadal Oscillation are part of a longer, ongoing change in global climate, said Josh Willis, a JPL oceanographer and climate scientist. Sea level rise and global warming due to increases in greenhouse gases can be strongly affected by large natural climate phenomenon such as the Pacific Decadal Oscillation and the El Nino-Southern Oscillation. In fact, said Willis, these natural climate phenomena can sometimes hide global warming caused by human activities. Or they can have the opposite effect of accentuating it.

-
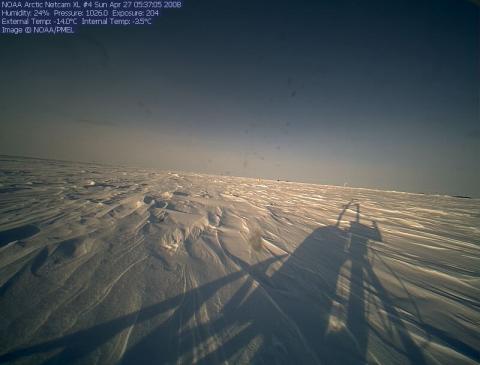
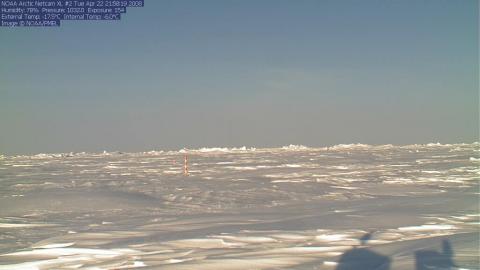
noaa 11
-
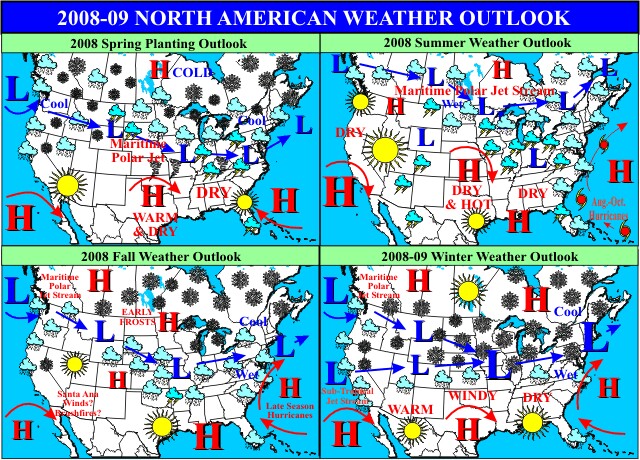
Qu�est-ce que vous pensez de l�été à venir
iceberg a répondu à un(e) topic de Rockabill dans Discussions générales
I will issue a summer forcast in 2 weeks time.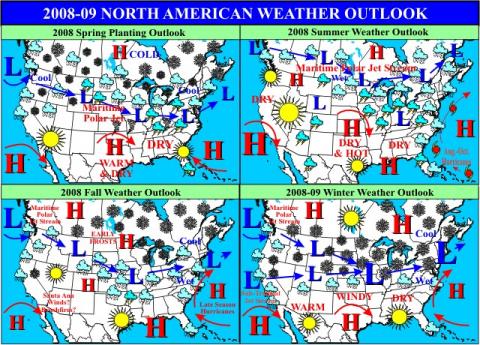
-
noaa 10
-
Oui tu a raison mes cest pas ma faute. il ya des journee comme ca !!
-
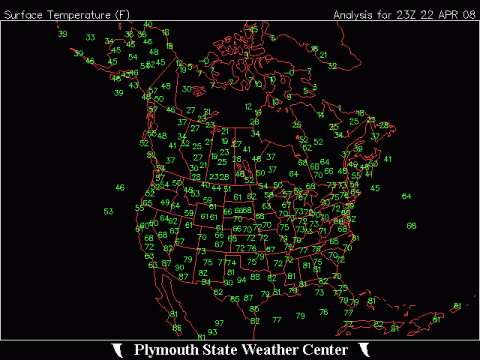
Temp de surface... pour Amerique du nord...
-
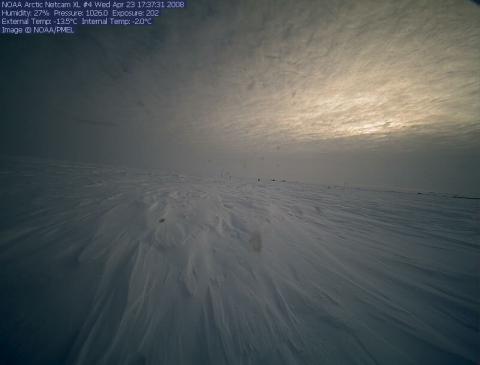
NOAA 8
-
LE 22 AVRIL 2008.
-
what is the purpose ??? Je pense en donnent plus de information possible sur la meteo ne fait pas mal. Surtout que un nouveau record peut etre battus.
-
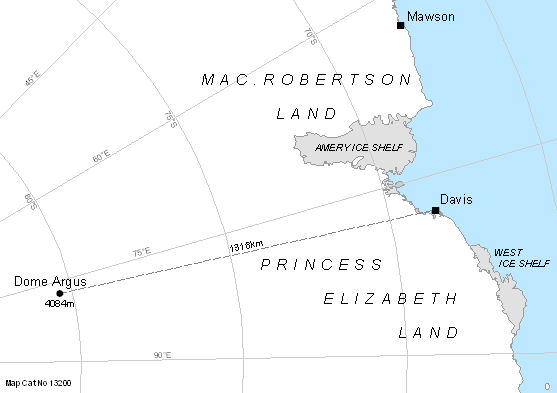
This is the link: http://www.aad.gov.au/weather/aws/dome-a/index.html
-
pour coyote il ya des route a barrow cest comme une ville. voir google earth.
-
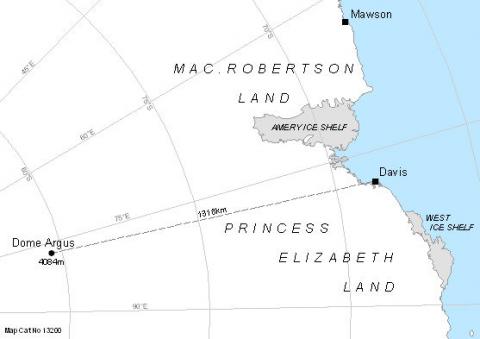
MAP FOR DOME A
-
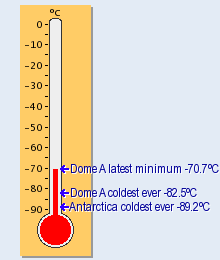
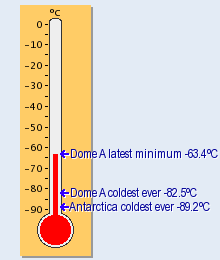
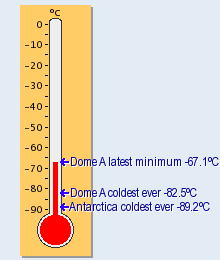
Dome A: Colder than Cold Dome Argus is the highest and possibly coldest place in Antarctica. There's a hot chance that an automatic weather station at Dome A will record the world's lowest surface temperature. The lowest temperature ever recorded was -89.2°C in July 1983, at the Russian station Vostok, inland of Australia's Casey station. Dome A is nearly 600 m higher in elevation than Vostok and the coldest temperature recorded at Dome A was -82.5°C in July 2005. Check here daily to see if the temperature can get colder than cold Latitude: 80 22" 02'S Longitude: 77 32"21'E Height: 4084 m Latest 24-hour-minimum temperature: -70.7°C

-
noaa 6
-
The week's hottest temperature was 113.0 degrees Fahrenheit (45.0 degrees Celsius) at Matam, Senegal. The week's coldest temperature was minus 93.8 degrees Fahrenheit (minus 69.9 degrees Celsius) at Russia's Vostok Antarctic research week ending April 18 2008.
-
GLOBAL WEATHER NEWS FOR MARCH.... Global Highlights The global land surface temperature was the warmest on record for March, 3.3°F above the 20th century mean of 40.8°F. Temperatures more than 8°F above average covered much of the Asian continent. Two months after the greatest January snow cover extent on record on the Eurasian continent, the unusually warm temperatures led to rapid snow melt, and March snow cover extent on the Eurasian continent was the lowest on record. The global surface (land and ocean surface) temperature was the second warmest on record for March in the 129-year record, 1.28°F above the 20th century mean of 54.9°F. The warmest March on record (1.33°F above average) occurred in 2002. Although the ocean surface average was only the 13th warmest on record, as the cooling influence of La Niña in the tropical Pacific continued, much warmer than average conditions across large parts of Eurasia helped push the global average to a near record high for March. Despite above average snowpack levels in the U.S., the total Northern Hemisphere snow cover extent was the fourth lowest on record for March, remaining consistent with boreal spring conditions of the past two decades, in which warming temperatures have contributed to anomalously low snow cover extent. Some weakening of La Niña, the cold phase of the El Niño-Southern Oscillation, occurred in March, but moderate La Niña conditions remained across the tropical Pacific Ocean
-
noaa 5
-
noaa 3