-
Compteur de contenus
1 349 -
Inscription
-
Dernière visite
-
Jours gagnés
47
Type de contenu
Profils
Forums
Events
Gallery
Tout ce qui a été posté par iceberg
-
-
-
-
Is This The Last Barrier to a Climate Collapse? Dr. Tim Flannery, an Australian global warming activist, mammalogist and palaeontologist has proposed a radical solution to slow down global warming, which in his words is the last barrier to a climate collapse, according to The Age. Flannery say's climate change is happening so quickly that mankind may need to pump sulphur into the upper atmosphere in order to survive. His technique places sulphur gas into the earth's stratosphere to block out more of the sun's rays. How would this be done? Sulphur would be added to jet fuel and dispersed in the stratosphere. When should this happen? Flannery says we may need to be doing this in five years time. This process would also cause the sky to change color. But what color? Yellow? According to Flannery, the world was much more susceptible to greenhouse gas emissions that had been thought eight years ago. "Regardless of what happened to emissions in the future, there was already far too much greenhouse gas in the atmosphere," he said. "Cutting emissions was not enough. Mankind now has to take greenhouse gases out of the air," he added. In particular, carbon should be taken out of the air and converted into charcoal, then plowed into farmers' fields. Flannery was named Australian of the year for 2007. AP
-
-
-
-
-
-
la neige a 16c a lynn lake !!! 16 May 2008 22:00 Mostly Cloudy 8 68 2 N 22 gust 39 100.9 15 21:00 Mainly Sunny 12 41 -1 NW 17 100.8 15 20:00 Mainly Sunny 14 36 -1 NW 30 gust 41 100.8 15 19:00 Mainly Sunny 14 35 -1 NW 24 gust 46 100.8 15 18:00 Light Snow 16 28 -2 NW 42 gust 59 100.7 15 17:00 Light Snow 16 29 -2 NW 45 gust 63 100.6 15 16:00 Sunny 16 33 0 NW 41 gust 50 100.6 15 15:00 Sunny 16 37 1 NW 42 gust 52 100.6 15 14:00 Sunny 16 38 1 NNW 35 100.6 15 13:00 Light Drizzle 14 42 1 WNW 35 gust 50 100.7 15 12:00 Sunny 14 44 2 NW 32 100.6 15 11:00 Sunny 13 48 2 NW 26 gust 37 100.6 15 10:00 Sunny 12 51 2 NW 28 gust 39 100.6 15 9:00 Sunny 10 61 3 NW 32 100.6 15 8:00 Sunny 8 72 3 NW 30 100.5 15 7:00 Sunny 7 80 3 NW 28 100.5 15 6:00 Sunny 6 83 3 NW 21 100.4 15 5:00 Clear 6 86 4 NW 18 100.3 15 4:00 Clear 6 89 4 WNW 18 100.3 15 3:00 Clear 6 88 4 W 15 100.3 15 2:00 Clear 6 90 4 SW 13 100.3 15 1:00 Rain 7 86 5 N 11 gust 50 100.5 5 00:00 Rain 9 72 4 SW 15 100.5 link : http://www.weatheroffice.gc.ca/trends_tabl...l_metric_e.html
-
Updated Summer Monthly Forecast The newly updated European model monthly forecast for North America was just released yesterday. The most glaring thing I see from the forecast is the reflection of the cooler phase of the PDO (Pacific Decadal Oscillation). The model is now clearly seeing this and is forecasting below normal temperatures right along and just off the West Coast of North America from Alaska to southern California through a good part of the summer. The model also continues to forecast some upper atmospheric blocking (ridge of high pressure) between Labrador and Greenland through July, similar to what we are seeing currently in May. The blocking then backs off to the northeast (eastern Greenland) by August. Here is how I interpret what the model is forecasting in terms of the mean pattern during a particular month...... June The model predicts a weak upper-level high (ridge) near the Aleutians and just north of Labrador. There also appears to be a positive phase of the Arctic Oscillation. Possible impacts..... --Very warm compared to normal over the Intermountain region of the western U.S. --Cooler and slightly wetter than normal in British Columbia down through Washington and Oregon. --Above-normal temperatures in northern Canada, but cooler in the Arctic region. --Slightly cooler than normal for eastern Canada and the Maritimes. --Above-normal temperatures and drier than normal conditions for the western prairies. --More thunderstorms compared to normal over Manitoba and northwestern Ontario. --Wetter pattern over the Northeastern U.S. July The model predicts fairly similar upper-level conditions as those for June. --Drier than normal over the Southwestern U.S. --Cooler and slightly wetter than normal from the Pacific Northwest coastal region then up into western BC. --Hot across the interior West of the U.S. and southwestern prairies. --Near to slightly cooler than normal temperatures from the Midwestern U.S> through the Northeast and into Eastern Canada and the southern Maritimes. More widespread showers and thunderstorms compared to normal from the Midwestern U.S. through the Northeast and into eastern Canada. --Not a hot month for the Southeast U.S accord ing to the model., but I fear the lack of moisture in the ground could actually make it hotter than normal due to a reduction of evaporative cooling. August --The immediate West Coast remains cooler than normal from Oregon through BC. --A hot month relative to normal from the U.S. Rockies into the central Plains, including the southwestern Prairie region of Canada. --Temperatures for much of the eastern U.S. and eastern Canada are near normal. --Greater than normal rainfall along the Gulf coast. --More widespread showers and thunderstorms compared to normal over Ontario, the Great Lakes and interior Northeast. --More humid with possible tropical rainstorm influences over the coastal Maritimes and Newfoundland the second half of the month. Accuweather....... Brett Anderson
-
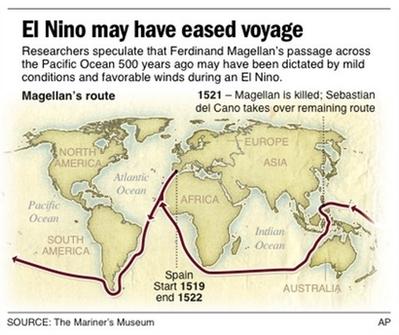
By RANDOLPH E. SCHMID, AP Science Writer WASHINGTON - The El Nino phenomenon that has puzzled climate scientists in recent decades may have assisted the first trip around the world nearly 500 years ago. Explorer Ferdinand Magellan encountered fair weather on Nov. 28, 1520, after days of battle through the rough waters south of South America. From there his passage across the Pacific Ocean may have been eased by the calming effects of El Nino, researchers speculate in a new study. When an El Nino occurs, the waters of the Equatorial Pacific become warmer than normal, creating rising air that changes wind and weather patterns. The effects can be worldwide, including drought in the western Pacific and more rain in Peru and the west coast of South America. Tree ring data indicate that an El Nino was occurring in 1519 and 1520 and may even have begun in 1518. After passing through the strait later named for him, Magellan sailed north along the South American coast and then turned northwest, crossing the equator and eventually arriving at the Philippines, where he was killed in a battle with natives. Magellan was seeking the so-called spice islands, now part of Indonesia, and his course took him north of that goal. But the route may have been dictated by mild conditions and favorable winds during an El Nino, anthropologists Scott M. Fitzpatrick of North Carolina State University and Richard Callaghan of the University of Calgary, Canada, propose in a new study of his trip. Their research is summarized in Friday's edition of the journal Science and is scheduled to be published in full in the August edition of the Journal of Pacific History. They were studying early exploration trips and were struck by the fact that Magellan sailed unusually far north, Fitzpatrick explained in a telephone interview. "We had not considered El Nino until afterward, when we were trying to account for why the winds were so calm when he came into the Pacific," he said. "We knew it was unusual." The researchers used a computer to model wind and weather conditions across the Pacific during an El Nino and then compared that to Magellan's route. Magellan's journals show that many of the crew had died or were sick with scurvey, so he may simply have chosen to sail with the existing winds and currents, reducing the number of crew needed to operate his ships, Fitzgerald said. "It could have been an adept maneuver," the researchers wrote, allowing him to move west along the past of least resistance. In his writings, Magellan said he chose the northerly route because of reports of a famine in the spice islands. This also could be accurate, Callaghan and Fitzpatrick say, as El Nino conditions often result in drought in that region. Magellan had received correspondence from a friend in the spice islands before setting out and so may have known about a famine there, Fitzgerald said. But that cannot be determined for certain, because the correspondence was destroyed in the great Lisbon earthquake of 1755. While the actual reasons for Magellan's choice of route remain uncertain, El Nino conditions "may have been largely responsible for structuring the route and extent of what many consider the world's greatest voyage," the researchers wrote. The trip, in fact, may be the earliest record of an El Nino, Fitzpatrick said. Sir Francis Drake encountered mild conditions in the Strait of Magellan when he sailed through in 1578, but he then faced months of Pacific storms that scattered his ships, sinking one. Captain James Cook seems also to have benefited from El Nino conditions centered on 1769 during his Pacific exploration.
-
-
-
-
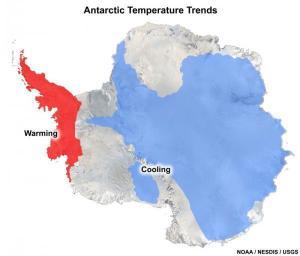
Climate Models Overheat Antarctica, New Study Finds (May 8, 2008) Computer analyses of global climate have consistently overstated warming in Antarctica, concludes new research by scientists at the National Center for Atmospheric Research (NCAR) and Ohio State University. The study can help scientists improve computer models and determine if Earth's southernmost continent will warm significantly this century, a major research question because of Antarctica's potential impact on global sea-level rise. "We can now compare computer simulations with observations of actual climate trends in Antarctica," says NCAR scientist Andrew Monaghan, the lead author of the study. "This is showing us that, over the past century, most of Antarctica has not undergone the fairly dramatic warming that has affected the rest of the globe. The challenges of studying climate in this remote environment make it difficult to say what the future holds for Antarctica's climate." The study marks the first time that scientists have been able to compare records of the past 50 to 100 years of Antarctic climate with simulations run on computer models. Researchers have used atmospheric observations to confirm that computer models are accurately simulating climate for the other six continents. The models, which are mathematical representations of Earth's climate system, are a primary method for scientists to project future climate. Antarctica's climate is of worldwide interest, in part because of the enormous water locked up in its ice sheets. If those vast ice sheets were to begin to melt, sea level could rise across the globe and inundate low-lying coastal areas. Yet, whereas climate models accurately simulate the last century of warming for the rest of the world, they have unique challenges simulating Antarctic climate because of limited information about the continent's harsh weather patterns. The study was published on April 5 in Geophysical Research Letters. It was funded by the National Science Foundation, NCAR's primary sponsor, and the Department of Energy. The authors compared recently constructed temperature data sets from Antarctica, based on data from ice cores and ground weather stations, to 20th century simulations from computer models used by scientists to simulate global climate. While the observed Antarctic temperatures rose by about 0.4 degrees Fahrenheit (0.2 degrees Celsius) over the past century, the climate models simulated increases in Antarctic temperatures during the same period of 1.4 degrees F (0.75 degrees C). The error appeared to be caused by models overestimating the amount of water vapor in the Antarctic atmosphere, the new study concludes. The reason may have to do with the cold Antarctic atmosphere handling moisture differently than the atmosphere over warmer regions. A chilling ozone hole Part of the reason that Antarctica has barely warmed has to do with the ozone hole over the continent. The lack of ozone is chilling the middle and upper atmosphere, altering wind patterns in a way that keeps comparatively warm air from reaching the surface. Unlike the rest of the continent, the Antarctic Peninsula has warmed by several degrees, in part because the winds there are drawing in warmer air from the north. The models generally capture these wind changes, although sometimes incompletely. The study delivered a mixed verdict on Antarctica's potential impact on sea-level rise. The Intergovernmental Panel on Climate Change, which operates under the auspices of the United Nations, has estimated that sea-level rise could amount to 7 to 23 inches (18-59 centimeters) this century, in part because of melting glaciers worldwide. The Geophysical Research Letters paper suggests that warming in Antarctica over the next century could offset that by about 2 inches if the continent warms by 5.4 degrees F (3 degrees C), as computer models have indicated. The reason is that the warmer air over Antarctica would hold more moisture and generate more snowfall, thereby locking up additional water in the continent's ice sheets. But the authors caution that model projections of future Antarctic climate may be unreliable. "The research clearly shows that you can actually slow down sea-level rise when you increase temperatures over Antarctica because snowfall increases, but warmer temperatures also have the potential to speed up sea-level rise due to enhanced melting along the edges of Antarctica," says Monaghan, who did some of his research at Ohio State University before coming to NCAR. "Over the next century, whether the ice sheet grows from increased snowfall or shrinks due to more melt will depend on how much temperatures increase in Antarctica, and potentially on erosion at the ice sheet edge by the warmer ocean and rising sea level." "The current generation of climate models has improved over previous generations, but still leaves Antarctic surface temperature projections for the 21st century with a high degree of uncertainty," adds co-author and NCAR scientist David Schneider. "On a positive note, this study points out that water vapor appears to be the key cause of the problematic Antarctic temperature trends in the models, which will guide scientists as they work to improve the climate simulations." The University Corporation for Atmospheric Research manages the National Center for Atmospheric Research under primary sponsorship by the National Science Foundation (NSF). Opinions, findings, conclusions, or recommendations expressed in this document are those of the author(s) and do not necessarily reflect the views of the National Science Foundation, NASA, or other funding agencies. UPI
-
-
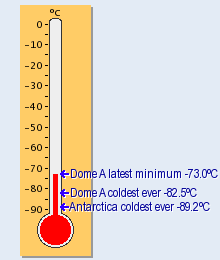
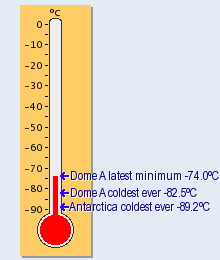
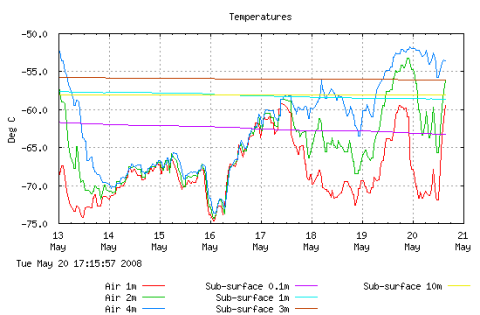
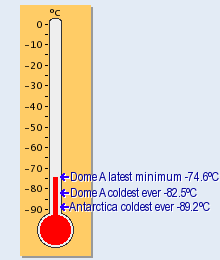
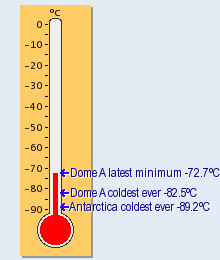
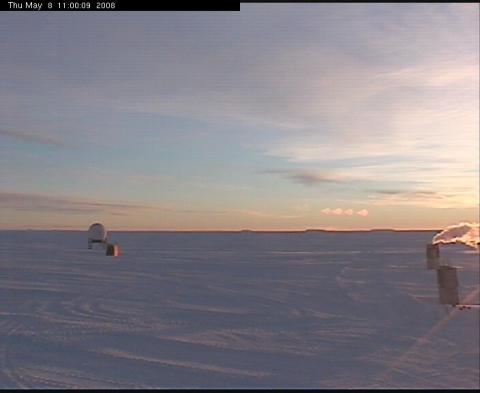
South Pole Weekly Climate Summary for 26 Apr - 02 May, 2008 Weekly Climate Summary for 26 April 2008 through 02 May 2008 UTC South Pole Station, Antarctica Temperature: Average temp... -52.8°C / -63.0°F Maximum temp... -33.5°C / -28.3°F on day 26 Minimum temp... -61.6°C / -78.9°F on day 29 Wind: Average wind speed.......... 8.2 mph or 7.1 knots Prevailing wind direction... Grid East Maximum wind speed.......... 17 mph or 15 knots on day 28 Maximum wind direction...... Grid Northeast Average vectored wind....... 047 degrees at 6.5 knots Station Pressure: Average pressure... 690.4 mb Highest pressure... 700.6 mb on day 26 Lowest pressure.... 684.4 mb on day 1 Physio-altitude: Average physio-alt = 10238 ft/ 3121 m Highest physio-alt = 10463 ft/ 3189 m on day 1 Lowest physio-alt = 9861 ft/ 3006 m on day 26 Sky Cover: Average cloud cover (8ths)... 3 Days clear................... 5 Days partly cloudy........... 1 Days cloudy.................. 1 Sunshine: Sunrise on 20 September 2008 Average hours per day... 0.0 Percent of possible..... 0 Visibility: 0 days with visibility of 1/4 mile or less. Balloon flight data: Number of soundings for the week..... 7 Average height of soundings.......... 59.2 mb, or 18881 meters Highest sounding..................... 28.1 mb, or 22837 meters on day 28/00Z flight 0 soundings were missed. **RECORDS**
-
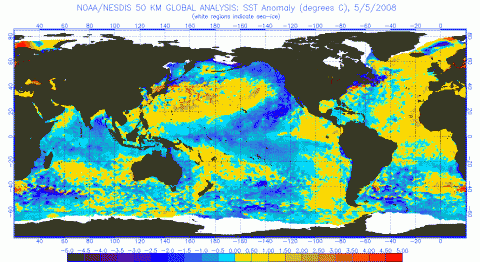
Interesting Changes in the Pacific Wednesday, May 07, 2008 There has been some talk in the media about this change going on in the Pacific Ocean and how it will slow global warming. That may be a bit of a stretch, but the changes could certainly have an impact on the long-term weather pattern in western Canada, especially British Columbia. What am I talking about? I am talking about the Pacific Decadal Oscillation (PDO). The PDO is a long-term pattern similar to the much shorter term El Nino/La Nina (ENSO phases), in which there is a fairly distinct pattern of sea surface heights in the North Pacific Ocean over a 5 to as much as 30 year period. There are still a lot of unknowns about the PDO, especially since the phrase was only coined just 12 years ago. According to one paper (Gershunov and Barnett 1998), ENSO teleconnections with North American climate show a strong dependence on the phase of the PDO. If the PDO is in the cool phase for a long period of time then there will likely be a decrease in El Nino events, while La Nina would be more common. Anyway, according to NASA'S Jet Propulsion Lab, the PDO appears to have shifted into the "cool" phase. Most of past two decades have seen the PDO in the "warm" phase. This link shows the classic warm and cool phase sea surface temperature anomaly patterns over the Pacific. It also shows a graph of the PDO index since 1900. Here is the latest sea-surface anomaly chart for the globe........ Note: the large area of above-normal sea surface water temperatures (higher heights) extending from southeastern Asia to north of Hawaii and the distinct area of cooler-than-normal water (lower than normal sea-surface heights) extending from the Gulf of Alaska to the West Coast of the U.S. and down into the central equatorial Pacific. Now if you look back at the link I posted, you can see that the cool phase example on the right matches fairly well with what is going on. Obviously, a couple of questions that come to mind are..... What will the impact be for Canada? I do not personally have a lot of experience with the PDO, but from what I have read it seems to suggest that the cool phase of the PDO would create an above-average northwestern North American snow pack in the spring, which we have seen. With that, you also get a greater spring time flood risk. Precipitation during the cold months from October to March across northwestern North America is above-average with below-normal temperatures. I assume northwestern North America includes the Alaska panhandle and British Columbia down to the pacific Northwest of the U.S. Not a lot is known about the influence farther to the east across central and eastern Canada. But, this past winter could be one example, especially being a La Nina winter. The second question is how long would PDO phase last. No one really knows, as you can see by the chart I linked to earlier there was a short "cool" phase around 1999-2003, but a much longer one from the late 40s to the mid 70s. No doubt this is interesting stuff. Brett Anderson ACCU WEATHER.
-
-
-
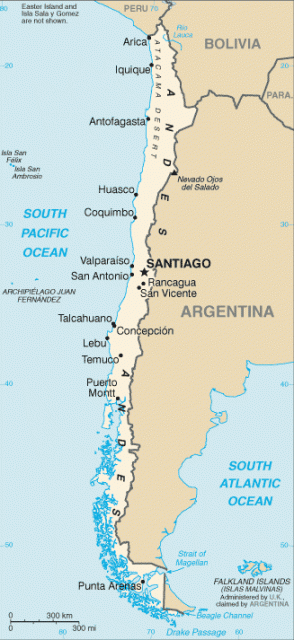
This is a link to the sight. http://www.aipchile.cl/camara/location.php note the volcano in the middle of the picture.
-
-
-
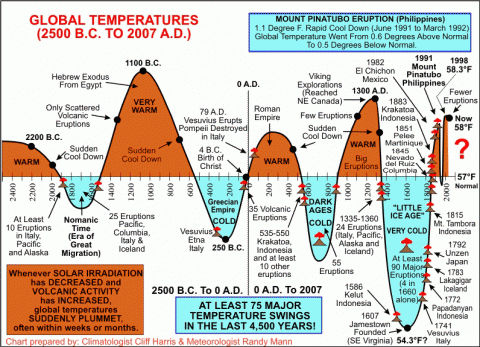
This is a paragraph i took from one of the stories i posted. Our climate would also cool very quickly if we were to see a series of MAJOR volcanic eruptions take place over a short period of time. Since the early 1990s, there has been an overall significant increase in volcanic activity in the Philippines, Japan, Indonesia, El Salvador, Tanzania, Mexico, Columbia, Italy, Alaska and our Pacific Northwest. Since the late 1990s, we've likewise seen a dramatic increase in undersea volcanic eruptions, especially in the western Pacific Ocean regions. Global temperatures cooled rather dramatically following the massive Mt. Pinatubo eruption in June of 1991 in the Philippines. Nearly 200 years before, there was an even more dramatic global cooling associated with the eruption of Mt. Tambora in 1815, which put an incredible EIGHT TIMES more volcanic material into the upper atmosphere than the recent strong eruption of Mt. Pinatubo. The following year, 1816, is still being referred to by New England's historians as "Eighteen-Hundred and Froze to Death". Snow fell every month that year at the higher elevations in the interior Northeast while freezes blackened crops that summer in the valleys from northern New England and southeastern Canada all the way south into the Carolinas. In the past few years, we've started to see a trend towards later frosts in the spring and earlier freezes in the fall seasons, despite the warmer than normal temperatures.


