

iceberg
-
Compteur de contenus
1 349 -
Inscription
-
Dernière visite
-
Jours gagnés
47
Type de contenu
Profils
Forums
Events
Gallery
Tout ce qui a été posté par iceberg
-
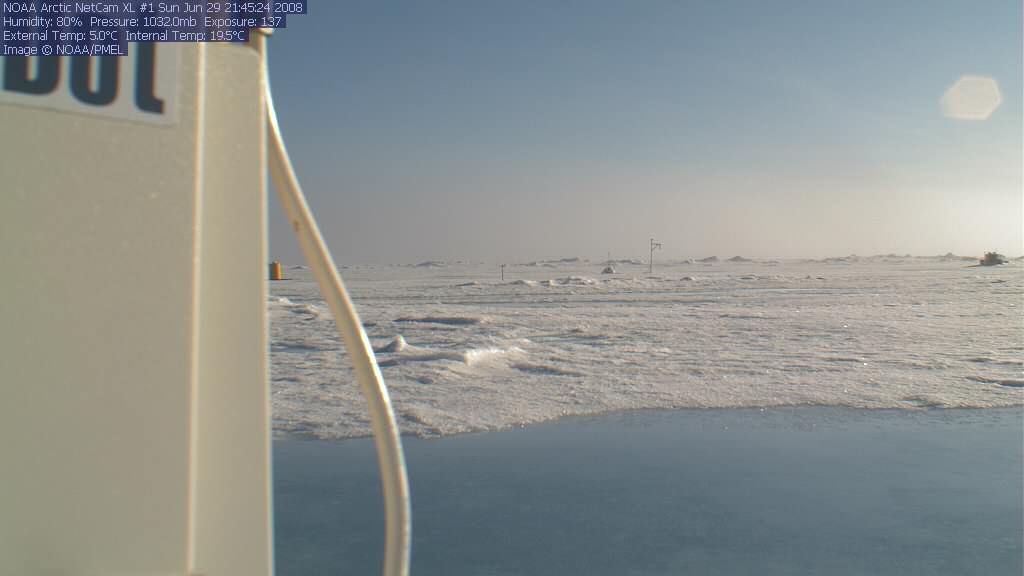
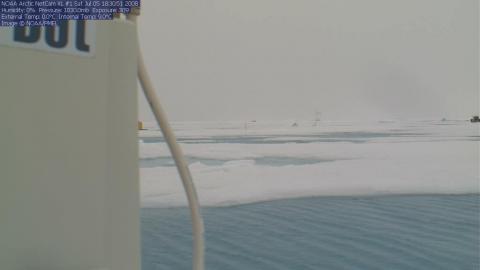
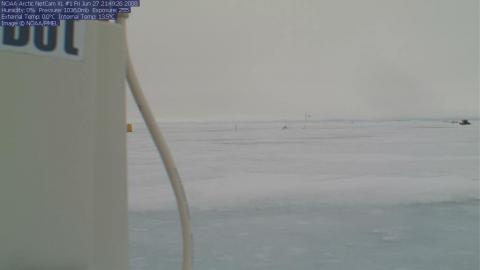
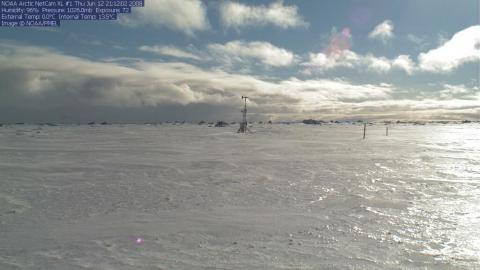
ICE UPDATE JULY 5TH 2008. ARCTIC ICE IS STILL 25% OVER LAST YEAR TO DATE IN SURFACE. WE COULD SEE ON SATALITE IMAGE A LARGE SURFACE AMOUNT OF THICK ICE ON SIBERIAS NORTH COAST SLOWLY TURNING TOWARD THE POLE BY JULY 10. SHOULD REACH IT BY THEN. AS I STATED 6 DAYS AGO A COLD LOW PRESSURE SYSTEM WILL SLOWLY REACH THE POLE BY JULY 8TH .THIS LOW PRESSURE FAIRLY STRONG FOR THIS TIME OF YEAR WILL BRING STRONG WINDS WITH BLOWING SNOW TO THE POLE BY JULY 8TH 2008.WEB CAM PICTURES WILL SEE TO IT LIVE FROM WHERE IT HAPPENS.AS YOU COULD SEE FROM PICTURE BELOW SMALL WAVELETS COULD BE SEEN AND ALSO NOTE THE TEMP AT 0.0C.THIS IS DEW TO THE STORM GETTING CLOSER TO THE POLE.
-
Prompt rétablissement Regg
iceberg a répondu à un(e) topic de JF Massicotte dans Discussions générales
Dont give up reg and all will be well and you will be twice as strong when you get back. Good wishes and lots of health when you get back. -
Ailleurs dans le monde - Juin 2008
iceberg a répondu à un(e) topic de dann17 dans Discussions générales
(June 27, 2008) Following the extremely hot weather conditions hitting Europe, Norway experienced its biggest forest fire in the last half century earlier this month. Envisat satellite images were used in the fires aftermath to get an overview of the damaged area for authorities and insurance companies. Extreme heat, dry conditions and strong winds quickly spread the fire in the cities of Mykland and Froland in the southern county of Aust-Agder, dampening fire-fighters attempts to squelch the blaze. Before being brought under control by more than 150 fire-fighters, aided by 16 helicopters (and much hoped for rain), the fire is estimated to have destroyed around 3000 hectares. To assess the full extent of the damage, Norways KSAT (the Kongsberg Satellite Services) compared Envisat acquisitions taken before and after the event. "At KSAT, we were quite surprised by how easy it was to detect the affected area in the image and to learn how extensive the damages are," Nina Soleng said. "We sent the images to the County Director of Forestry (Fylkesskogmester) of Aust-Agder County." Major fires are visible from space satellites detect not only the smoke billowing from major conflagrations but also the burn scars left in their wake. Even the fires themselves appear as 'hotspots' when the satellites sensors scan the Earth's surface in infrared wavelengths. More than 50 million hectares of forest are burnt annually, and these fires have a significant impact on global atmospheric pollution, with biomass burning contributing to the global budgets of greenhouse gases, like carbon dioxide. Satellites have proven to be vital tools for keeping track of fires and are able to keep forests under constant surveillance. ESA satellites have been surveying fires burning across the Earths surface for the last decade. Worldwide fire maps based on this data are now available to users online in near-real time through ESA's ATSR World Fire Atlas (WFA). The WFA data are based on results from the Along Track Scanning Radiometer (ATSR) instrument onboard ESAs ERS-2 satellite and the Advanced Along Track Scanning Radiometer (AATSR) onboard Envisat. These twin radiometer sensors work like thermometers in the sky, measuring thermal infrared radiation to take the temperature of Earth's land surfaces. By combining satellite-derived information, such as surface temperatures, land and vegetation cover and vegetation water content, with meteorological forecasting data, such as air temperature, wind speed and rainfall, forests can be systematically monitored to assess fire risks and allow fire fighters to plan fast and efficient actions to extinguish flames. Within the context of the Global Monitoring for Environment and Security (GMES) initiative, ESA and the European Commission (EC) have jointly demonstrated the ability of satellite-based observations to respond to the operational needs of fire fighting teams through projects such as RISK-EOS and PREVIEW. UPA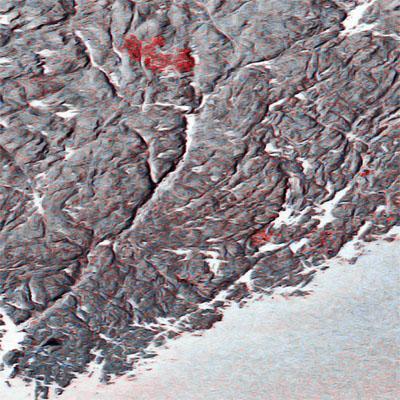
-
HIGH PRESSURE OVER GREENLAND A FAIRLY STRONG ONE IS CAUSING WINDS ALOFT FROM THE SOUTH SOUTH WEST GUSTING FROM 30 TO 60 K CAUSING STRONG ICE MELT TO FORM FROM ALONG THE COAST OF BAFFIN ISLAND. 10 TO 14 DAY FORCAST CALLS FOR A COOL DOWN OVER THE NORTH POLE. LOW PRESSURE OVER NORTHERN SIBERIA WITH COLD TEMPS AND SNOWING OVER Fedorova, Ostrov ,Polargmo, AND Saskylah ARE REPORTING SNOW AND BLOWING SNOW WITH TEMPS RANGING FROM -2C TO 0C.THIS MASS OF COLD AIR AND LOW PRESSURE WILL REACH THE NORTH POLE BY DAY 8 AND TEMPS WILL FALL BACK TO NORMAL.
-
1ST SEMI WATER POND OF THE YEAR BUILDS AROUND WEB CAM NO.1 JUNE 29 2008.

-
WASHINGTON HAS OTHER IDEAS OF THE NORTH POLE MELTDOWN !!! f the North Pole becomes ice-free this summer - the odds for that are 50-50, one scientist says - that doesn't mean that the whole Arctic region will become an open ocean. Mark Serreze of the U.S. National Snow and Ice Data Center in Colorado told The Independent, a London-based newspaper, "I'd say it's even-odds whether the North Pole melts out." The article, posted on the newspaper's Web site Friday, generated some confusion as to what would actually happen at the North Pole, and in the Arctic Ocean as a whole, as the summer melt season gears up in the next few weeks. In a telephone interview with LiveScience, Serreze explained that a melt-out at the North Pole wouldn't mean that all Arctic ice would melt. Rather, the thin, newly-formed ice around 90 degrees latitude could melt away for a few days. Such an event would be significant, he said, because any holes that have appeared in the ice at the North Pole up until now have been a result of winds pushing the sea ice around and creating cracks, not the melt-related processes that have taken hold in the Arctic in recent years. Usually, the North Pole is covered with thick, perennial ice that forms over several years. But during last summer's record melt, which opened up the fabled Northwest Passage, a substantial amount of older ice melted. (Typically only the thinner, first-year ice melts in the summer, while the thick, perennial ice survives.) Average sea ice extent at the end of the summer was 1.65 million square miles (4.28 million square kilometers), almost 30 percent lower than the previous record low. As winter cooled the Arctic waters, ice re-formed over the ocean, as it usually does. But this newly formed ice is thinner, first-year ice, more susceptible to melting once summer comes around again. As it happened, wind patterns and ocean currents over the last few months moved that newly formed ice smack over the North Pole, setting up the situation where at least a temporarily ice-free North Pole could form. "It's this symbolic thing, I think," Serreze told LiveScience. "This is where Santa Claus lives ... it kind of hits you in the stomach." The North Pole isn't the only part of the Arctic Ocean covered with this newly-formed ice - a substantial part of the region is capped by this thin frozen veneer. That "we're going to lose a bunch of ice," is more or less certain, Serraze said, but just where that melt will occur is "a roll of the dice." One factor affecting where and how much ice will melt this summer is the somewhat higher ice extent that re-froze this winter. (While the winter extent was higher this year than last year, it was still about 390,000 square miles (1 million kilometers) smaller than average - that's equal to an area about the size of Texas and New Mexico combined. Sea ice forms not by spreading out along the surface of the ocean, but rather as water just below the ice freezes onto the underside of the ice. This means that more ice probably also means slightly thicker ice, said Josefino Comiso of NASA's Goddard Space Flight Center, which helps monitor sea ice coverage. Thicker ice is more likely to survive the summer and become second-year ice, becoming thicker still in the winter. The North Pole is also cooler than lower Arctic latitudes, meaning North Pole ice could better resist melting. Even if it does, there's still the possibility that winds could move the ice around so that a hole that formed at a lower latitude could be pushed over the North Pole, making it ice-free, Serreze said. It's these weather patterns that scientists will be watching in the coming weeks to get a better sense of what will happen in the Arctic this summer. Serreze says that a warm spring season has put melting about on par with where it was at this point last year. But other scientists say this summer's melt is unlikely to be as spectacular as last year's. "We may not see a record minimum at all," said Tharston Markus, also of Goddard. Scientists are monitoring the sea ice extent daily and say that after the main melt occurs over the next few weeks, they'll have a better idea of what the minimum extent, which typically occurs in mid-September, might be. For now though, all they can do is watch and wait.
-
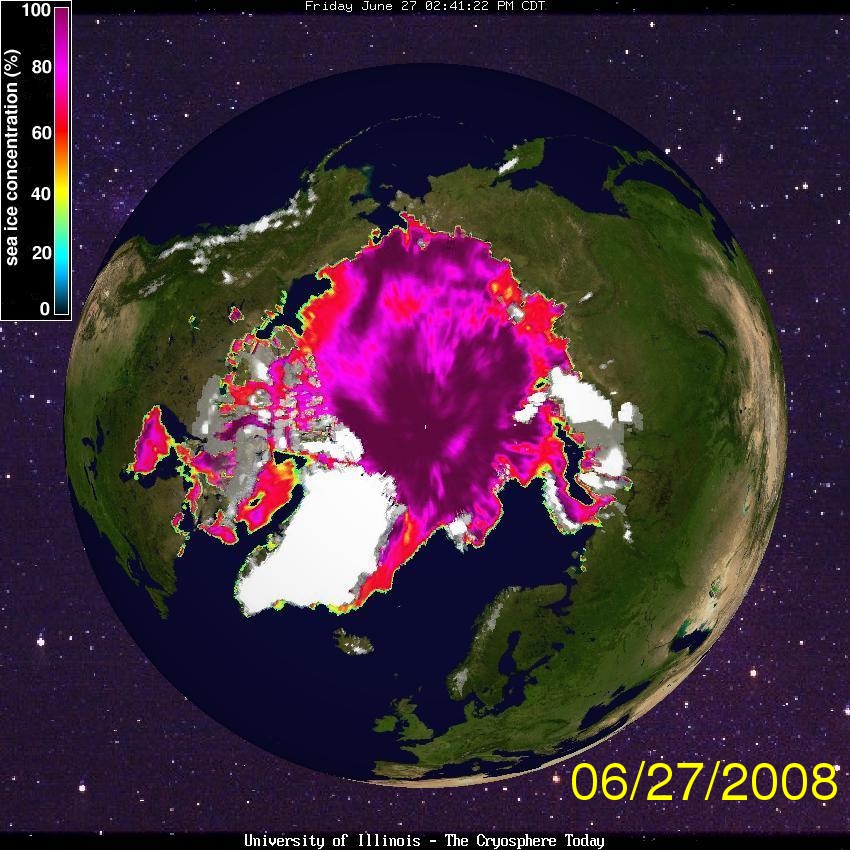
JUNE 27 2008.
-
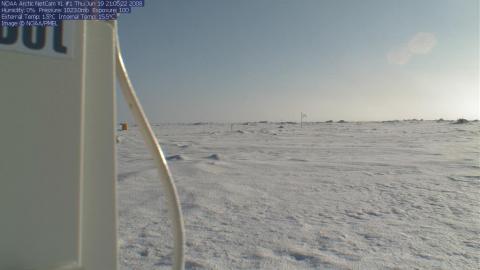
ICE UPDATE JUNE 2008. THIS YEARS ICE DEPTH AND TOTAL ICE SURFACE IS 25% GREATER THEN LAST YEAR JUNE 2007.WINDS ALOFT ARE NORMAL AND TOTAL SUNSHINE TO DATE IS 50 % LESS THEN LAST YEAR AT THIS TIME.THE REAL TEST WILL BE IN AUGUST WHEN SEA ICE BEGINS TO THIN OUT AROUND THE BEARING SEA.AT THIS TIME LAST YEAR THERE WERE SOME WATER HOLES AROUND THE WEB CAMS. THIS YEAR THERE ARE NONE TO BE FOUND BUT THE ICE IS THINNING OUT FAST AROUND ( Tuktoyaktuk ) AND ALONG THE COAST COMPARED TO LAST YEAR.

-
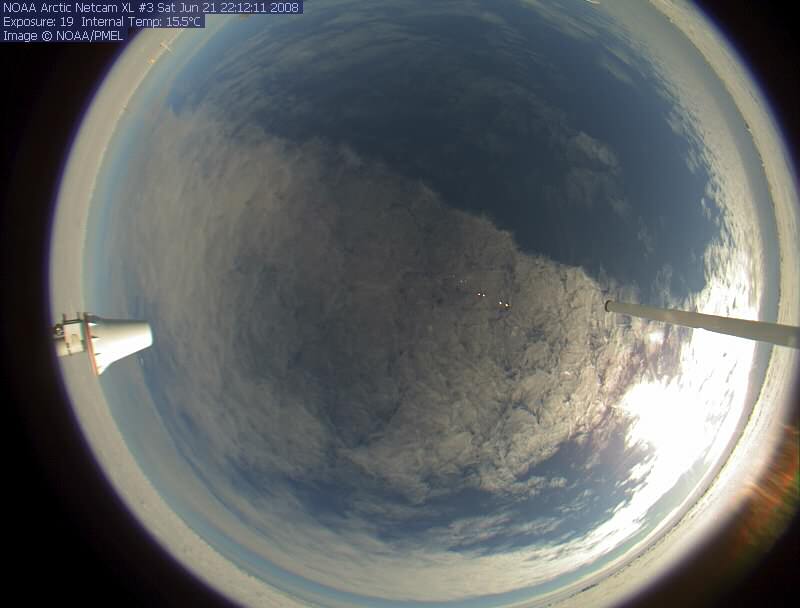
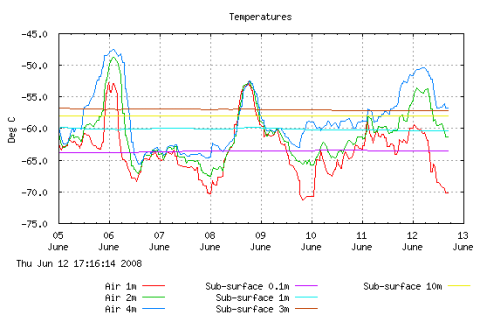
JUNE 21 2008.
-
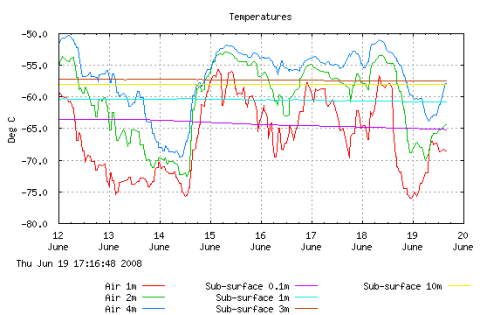
JUNE 19 2008.
-
JUNE 19 2008.
-
part 2
-
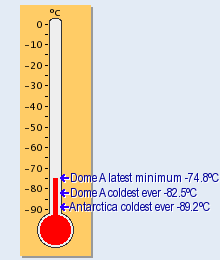
I will only give updates on dome A temps once a week or if i see that any cold fronts that are important that may drop the temp to near record values i will post it.
-
We are at a point soon where we will start to see some water ponds forming in about 10 days.
-
Ailleurs dans le monde - Juin 2008
iceberg a répondu à un(e) topic de dann17 dans Discussions générales
Tornados, Flooding May Warn Of Climate Change (Jun. 4, 2008) Record-keeping meteorologists at the National Oceanographic and Atmospheric Administration say this years tornado season is one of the deadliest in a decade and may be on pace to set a record for the most tornadoes. And flooding in the Midwest has been at 100-year levels this spring. There is considerable concern that climate change due to greenhouse gases species increasing will lead to the enhancement of strong, large storms occurrences, such as hurricanes that also spawn tornadoes when they occur. Increased storm strengths also bring flooding events, he said. Gaffney and co-researcher Nancy A. Marley are currently involved in a three-year investigation of aerosols tiny particles suspended in the air and their role in climate change.* Tornadoes are short-lived events and, until recently, scientists had to depend on limited ground observations to study them. Satellites and radar systems are now enhancing researchers ability to see their number and strength in detail. But short lived tornadoes are hard to tie directly to climate change due to the limited climatology of tornadoes. Weather forecasters have examined El Niño and La Niña, important temperature fluctuations in surface waters of the tropical eastern Pacific Ocean, as a potential for past tornado activities in the U.S. The data available from NOAA do not support a strong statistical significance to data for direct effects of El Niño or La Niña on frequency or strength of tornadoes, Gaffney said. Although, there is considerable concern that climate change due to greenhouse species will lead to significant changes in weather patterns, these currently available data are not conclusive. He said the Intergovernmental Panel on Climate Changes report on severe weather events discusses the topics backed up by NOAA data. Basic thought is theres more energy in the atmosphere, more water vapor evaporating and greater likelihood for stronger heating events that lead to stronger thunderstorms - super cells, that can lead to tornado production, Gaffney said. He said tornadoes are complex phenomena that are linked to the number of super cells and their storm strengths. Flooding events are more wide spread than tornadoes, and are more readily tied to climate predictions than tornadoes. What we are looking to see, in current and future research and data acquisition, is whether the frequency and strength of tornadoes change as we continue to increase the energy distribution in the atmosphere, he said. Currently, this year is looking to be significantly larger in the number of tornadoes seen than in the past few years. That and the record floods that are associated with these strong storm systems, may be a warning of things to come. But more data gathering is needed. Gaffney points to the improved Doppler radar systems that have allowed tornado warning times to be advanced as the main tool for gathering this tornado climatology that will be needed to evaluate links between climate change and severe weather events. *The $625,000 study is funded by the Department of Energy Atmospheric Science Program. He and Marley will discuss severe weather and links to climate during their annual orientation for the DOE Global Change Education Program. APA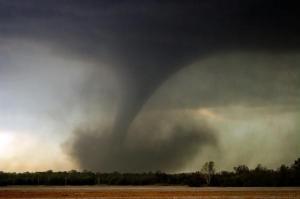
-
Ailleurs dans le monde - Juin 2008
iceberg a répondu à un(e) topic de dann17 dans Discussions générales
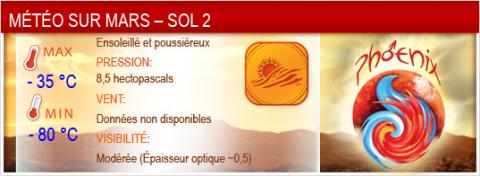
Bulletin de météo martienne link : http://www.space.gc.ca/asc/fr/exploration/phoenix_meteo1.asp -
Ailleurs dans le monde - Juin 2008
iceberg a répondu à un(e) topic de dann17 dans Discussions générales
The National Snow and Ice Data Center has just released their latest update (month of May) on the sea ice situation up in the Arctic. Here are some of the main highlights from their report..... Arctic sea-ice situation --Sea ice extent is below the long-term average. --Sea ice extent is very close to the low levels seen in May 2007. (May 2008 extent was 0.11 million sq. miles greater than May 2007). --Spring ice cover is thin. --The average decline rate this May was 3000 sq. miles per day faster than May 2007. --The average Arctic Ocean surface air temperatures in May were 1 to 3 degrees celsius (2 to 5 degrees F) above normal. --Thin ice that covers the Arctic Ocean is showing signs of early breakup. --There is a distinct lack of thick, resilient multi-year ice, but the thin ice is farther north than normal, which may make it less vunerable than if it was in its normal position.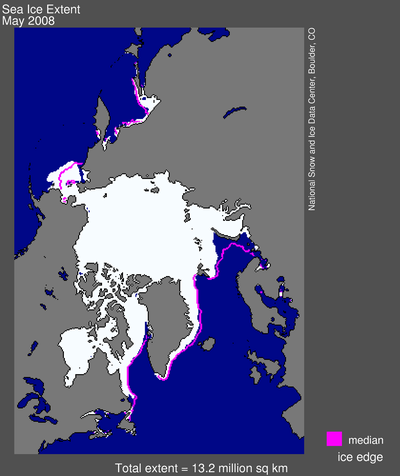
-
Ailleurs dans le monde - Juin 2008
iceberg a répondu à un(e) topic de dann17 dans Discussions générales
PRECIP FORCAST FOR SUMMER 2008 (BRETT ACCUWEATHER ) The second map below shows what I expect for summer precipitation. Keep in mind summer precipitation can vary greatly over short distances due to the convective (showers/t-storms) nature of precipitation. The neon green color indicates above-normal rainfall, the base green color indicates near-normal, while the yellow/brown color shows where I expect the summer to be drier than normal.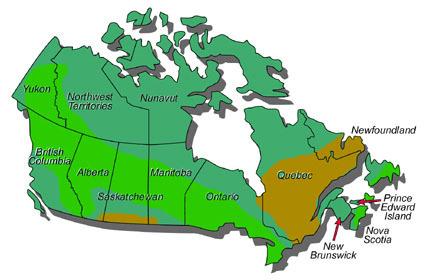
-
Ailleurs dans le monde - Juin 2008
iceberg a répondu à un(e) topic de dann17 dans Discussions générales
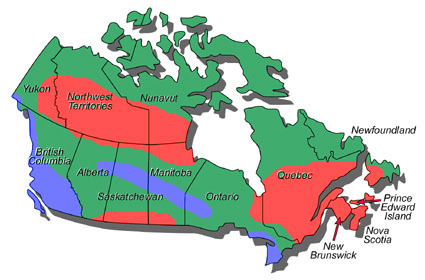
2008 SUMMER FORCAST ( BRETT FROM ACCUWEATHER ) After sorting through global land and ocean data, long range models and past climate I have finally come up with a summer 2008 forecast for Canada. Some of the more key things that I have considered....... --A fading La Nina --A cool phase of the PDO (Pacific Decadal Oscillation) --Much of the North Atlantic having above-normal sea-surface temperatures. --Cooler-than- normal Pacific waters from the Gulf of Alaska to the U.S. West coast and off of Baja (part of the cool phase PDO) --Drier-than-normal ground southern prairies. --I expect a more active Atlantic tropical storm/hurricane season with a greater than normal threat to Atlantic Canada, especially in late- August and September. --The mean position of the U.S. high Plains ridge of high pressure will allow a greater than normal amount of thunderstorm complexes to track from the central Plains to the Great Lakes as they run along the "rim of the ridge" The top map shows my prediction for temperatures across Canada for the summer as a whole. The red areas are above normal, green near normal and blue is below normal.
-
METEO MARS SOL 2
-
LE 28 MAI 2008.
-
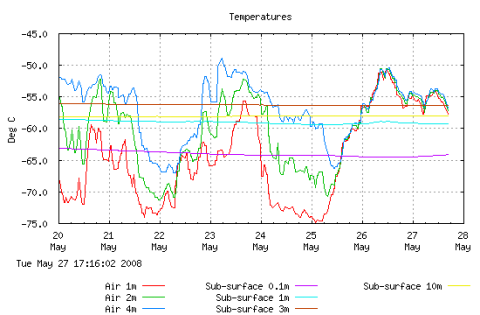
NOAA 37
-
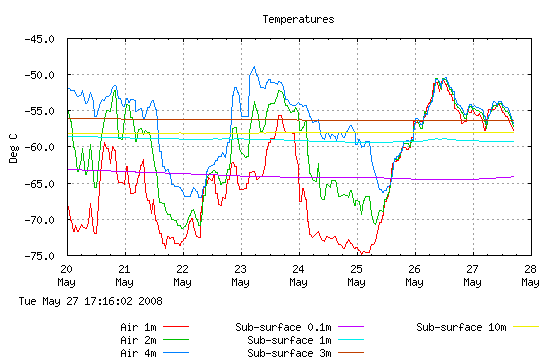
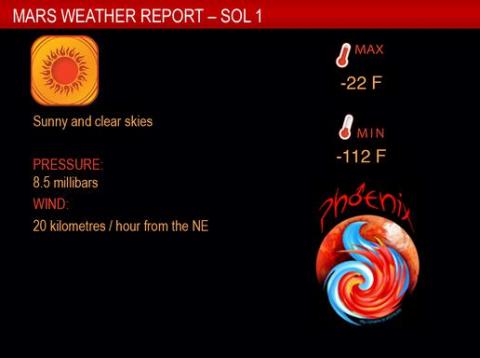
METEO MARS SOL 1 meteo mars pour le 27 Mai 2008. Skies were clear and sunny on Sol 1 on Mars. The temperature varied between minus 80 degrees in the early morning and minus 30 C degrees in the afternoon. The average pressure was 8.55 millibars, which is less than a 1/100th of the sea level pressure on Earth. The weather station was activated in the first hour after landing on Mars. Measurements are being recorded continuously. The Phoenix Mission is led by the University of Arizona, Tucson, on behalf of NASA. Project management of the mission is by NASA's Jet Propulsion Laboratory, Pasadena, Calif. Spacecraft development is by Lockheed Martin Space Systems, Denver. The Canadian Space Agency contributed Phoenix's meteorological station. The University of Aarhus in Denmark contributed the telltale on the meteorology mast. Image Canadian Space Agency/University of Aarhus
-
LE 26 MAI 2008.
-
NOAA 36