

iceberg
-
Compteur de contenus
1 349 -
Inscription
-
Dernière visite
-
Jours gagnés
47
Type de contenu
Profils
Forums
Events
Gallery
Tout ce qui a été posté par iceberg
-
Un dur hiver à venir ? hard winter to come ?
iceberg a répondu à un(e) topic de iceberg dans Discussions générales
Mr. A.Theunissen tell us why its going to be a warm winter and what information do you have to back up your forcast. all i know is that my friends at SMITH AND BARNEYS tell me that this winter will be colder then normal and above normal for snowfall now im betting that this winter will be a old fashion winter from the indices that im looking at. SMITH AND BARNEY work with the stock market on food commodities and they forcast long trend futures and let me tell you they have to be right on the money 95 % of the time when you have millions being invested in the stock market. -
Un dur hiver à venir ? hard winter to come ?
iceberg a répondu à un(e) topic de iceberg dans Discussions générales
check out this site on this coming winter 2008-09 http://atownwxwatcher.blogspot.com/ -
Un dur hiver à venir ? hard winter to come ?
iceberg a répondu à un(e) topic de iceberg dans Discussions générales
PAS DE ELNINO CETTE HIVER !!!! Temps will be in normal mode in the pacific basin by november and below normal by january. Winters of this calibre bring extreme temp swings for southern Quebec. If i would take a guess this winter would be like the winter of 2002-03. all signs point to a old fashion winter. -
AccuWeather.Com Winter ForecastUpdated: Thursday, October 09, 2008 2:18 PM2008-09 Winter to Be a Cold Slap in the Face in the East AccuWeather.com Meteorologist Joe Bastardi Forecasts Coldest Winter in Five Years In The Eastern US Today, AccuWeather.com Chief Long-Range Forecaster Joe Bastardi released his 2008-09 Winter Season Forecast addressing issues of average temperature and precipitation impacting the nation. His forecast calls for one of the coldest winters in several years across much of the East. The core of cold was centered across the Great Plains last year but is expected to be farther east this year. Bastardi says the winter of 2008-2009 will be viewed as the hardest in several years. "It may be a shock to some when compared with the above-average temperatures of last year in the East. It will put some 'brrrrrr' in the saddle of folks who have not had to deal with such things for a while," he cautions. "In the eastern half of the nation, people will look at the winter as bookends of cold," Bastardi said. He says the overall colder and snowier winter will be off to a cold start in December with perhaps the roughest winter month for much of the nation. It may finish with another cold spell in late January and February. Between the bookends of cold, Bastardi expects "the January thaw of old winter lore" but it will offer only a temporary break to consumers. "The winter as a whole in the population-dense eastern third of the nation will be a one-two punch of higher heating prices and lower temperatures. Given this economic environment, the winter could push some homeowners to the brink," he concludes. In some cases, homeowners trying to keep their residences as warm as last winter could spend hundreds of dollars more this heating season. Temperatures across most of the West will be warmer than last year and should be warmer than normal, which will help consumers by keeping heating cost increases in check. The northern Rockies and Northwest will still have more snow than normal but not as much as last year, where some locations developed a snow pack that reached twice normal levels. The Great Plains was blasted by snow last year, and many communities ran very low on salt to keep roads clear of ice. Despite the elevated cost of salt this winter season, these areas will receive a break in the form of less snow than last year. Unfortunately, the East will not turn out as lucky, as more snowfall than last year is expected.
-
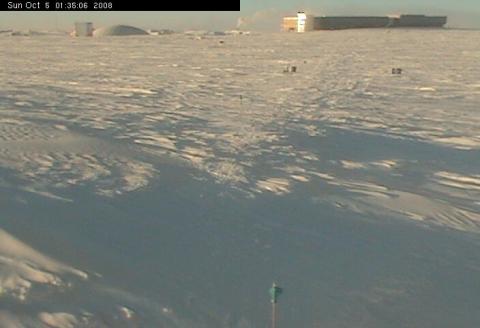
BIENVENUE -WELCOME LIVE FROM THE SOUTH POLE CURRENT TEMP -53C TIME 9:52PM EST
-
2008 Sea Ice Minimum Announcement Arctic sea ice reached its 2008 minimum extent on September 12th, at 4.52 million square kilometers (1.74 million square miles), according to preliminary data reported by the National Snow and Ice Data Center (NSIDC). The 2008 minimum represents the second lowest extent recorded since satellite observations began in 1979, slightly greater than the record low minimum of 2007. The 2008 minimum extent, which is well below the 19792007 average minimum of 6.7 million square kilometers, indicates a continuation of the strong downward trend of summer sea ice in the Arctic. The ice cover continues to thin, with less older (multi-year) ice. In addition, for the first time since recorded observations, the ice has retreated away from the coast along the entire perimeter of the Arctic, opening both the Northern Sea Route (Northeast Passage) along the coast of Siberia and the Northwest Passage along the North American coast. From the NSIDC...
-
web cam animation of camera 1 LIVE FROM THE NORTH POLE.... here is the link....enjoy http://www.arctic.noaa.gov/np2008/cam1-2008web.mov ps.. look at the wind vane moving and try to predict where the wind storms are coming from...
-
test
-
2 eye walls will hit galveston the second eye wall will follow 1 hour later which will give a greater punch to the area.
-
as you can see 2 eye walls are forming and dry air to the west flank of the hurricane is now being forced out and bands of precip reaching houston now.
-
Hurricane Ike The latest data i just recieved from my friend dave myers from the hurricane center in miami is that the eye of the storm is closing which is a dangerous sign . It looks like it will be a catagory 3 storm just as it hits land. This storm is not as dangerous as katrina for the wind criteria but the diff is its a larger storm that will affect many people and many people will die if they did not hid the warnings. The main diff with this storm is the wall of water that will incompass the galveston reigion .
-
ailleurs dans le monde - Août 2008
iceberg a répondu à un(e) topic de colapster89 dans Discussions générales
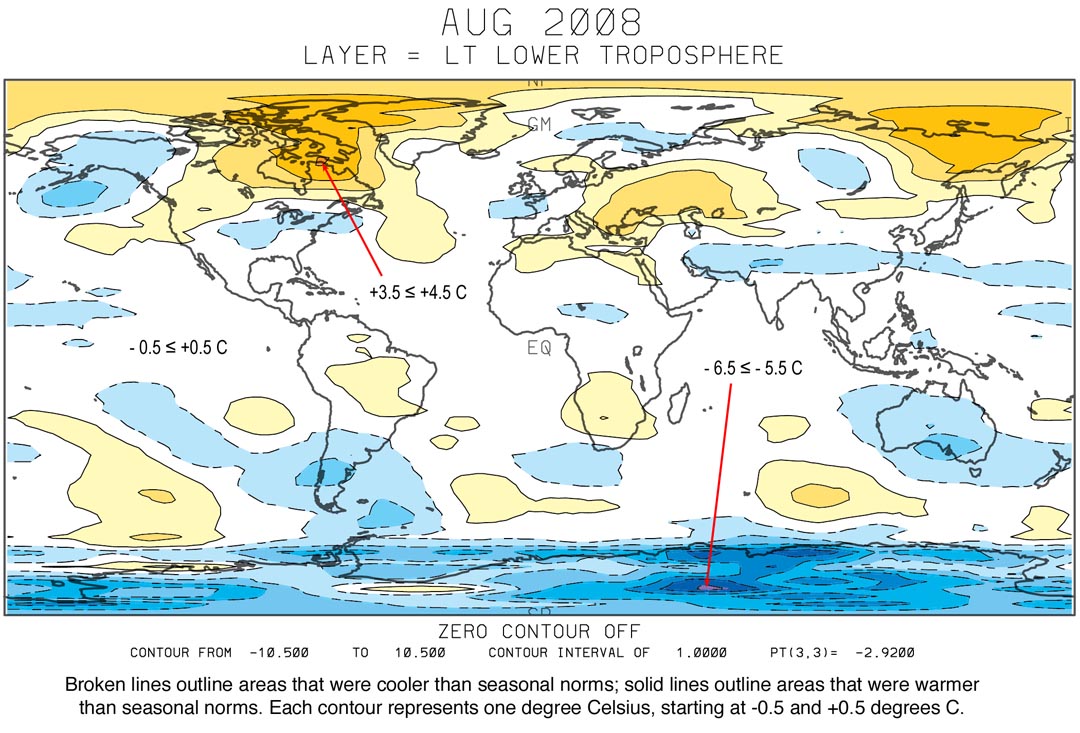
Global Temperature Report: August 2008 Global trend since Nov. 16, 1978: +0.13 C per decade August temperatures (preliminar) Global composite temp.: -0.01 C (about 0.02 degrees Fahrenheit) below 20-year average for August. Northern Hemisphere: +0.17 C (about 0.31 degrees Fahrenheit) above 20-year average for August. Southern Hemisphere: -0.19 C (about 0.34 degrees Fahrenheit) below 20-year average for August. July temperatures (revised): Global Composite: +0.05 C above 20-year average Northern Hemisphere: +0.10 C above 20-year average Southern Hemisphere: ±0.00 C at 20-year average (All temperature variations are based on a 20-year average (1979-1998) for the month reported.)
-
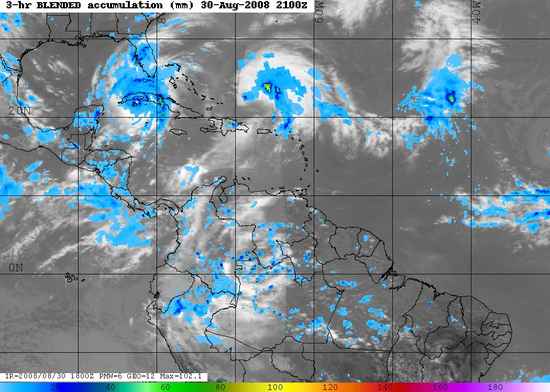
rain rates for tropics central and atlantic

-
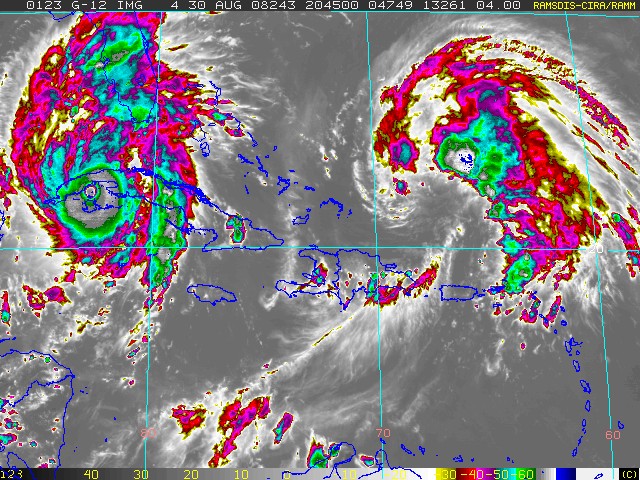
gustav and hanna
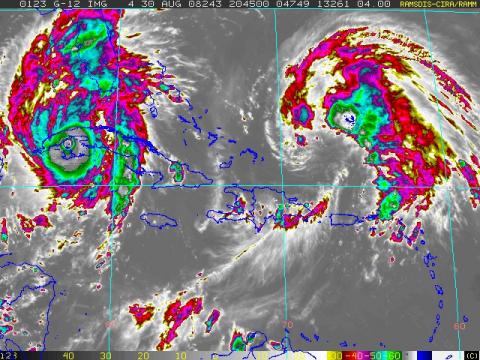
-
latest image on both storms
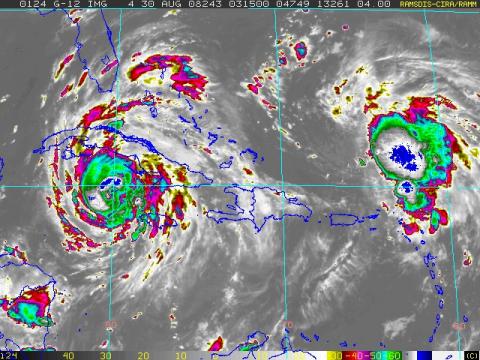
-
ailleurs dans le monde - Août 2008
iceberg a répondu à un(e) topic de colapster89 dans Discussions générales
Alertes/avertissements Arctic Bay 1h06 HAE le jeudi 21 août 2008 un avertissement de neige pour Arctic Bay est maintenu Neige abondante continuant aujourd'hui. Une intense dépression a apporté des vents très forts d'ouest à nord-ouest sur Hall Beach et Igloolik mercredi. On a signalé des vents du nord-ouest de 60 à 80 km/h avec rafales jusqu'à 100 au cours de la journée. Les vents ont commencé à diminuer au cours de la soirée, et soufflent maintenant sous le seuil d'avertissement. Les vents pourraient augmenter quelque peu plus tard ce matin, mais devraient demeurer juste sous le seuil d'avertissement aujourd'hui. À Arctic Bay, on a signalé 7 cm de neige mercredi soir, la majeure partie de cette neige est tombée tout au long de la journée. La neige, le brouillard, les vents forts et la visibilité mauvaise y persisteront aujourd'hui. L'accumulation totale de neige devrait varier de 15 à 25 cm d'ici à ce qu'elle cesse cette nuit. -
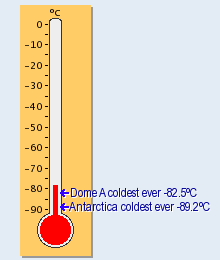
Latest minimum temperature at Dome A, Tuesday 19 August 2008, 02:59 AM: -79.7°C (-111.5°F)
-
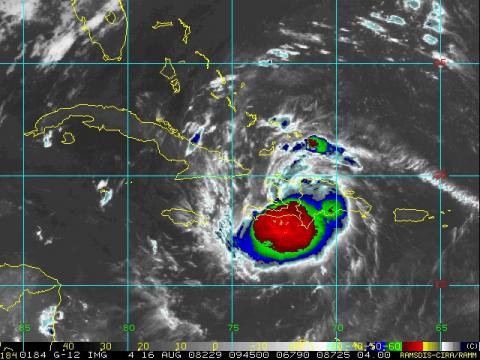
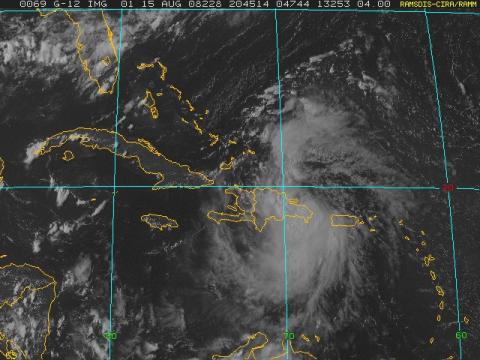
TROPICAL STORM FAY DISCUSSION NUMBER 3 NWS TPC/NATIONAL HURRICANE CENTER MIAMI FL AL062008 500 AM EDT SAT AUG 16 2008 EVEN THOUGH WE CANNOT DETERMINE EXACTLY WHERE THE CENTER OF FAY IS LOCATED...SATELLITE IMAGERY AND DATA FROM AN AIR FORCE RECONNAISSANCE AIRCRAFT SUGGEST IT IS STILL INLAND...OVER SOUTH-CENTRAL HISPANIOLA NEAR THE BORDER BETWEEN THE DOMINICAN REPUBLIC AND HAITI. THE AIR FORCE PLANE CIRCUMNAVIGATED THE ENTIRE ISLAND OF HISPANIOLA DURING THE PAST FEW HOURS...ENDURING SOME RATHER TURBULENT CONDITIONS...ESPECIALLY WITHIN THE STRONGEST THUNDERSTORMS NEAR THE SOUTHERN COAST...AND WE APPRECIATE THE HARD WORK OF THE CREW. FLIGHT-LEVEL AND SFMR DATA FROM THE AIRCRAFT SUPPORT MAINTAINING THE INTENSITY AT 40 KT. FAY REMAINS BENEATH A LARGE UPPER-LEVEL ANTICYCLONE RESULTING IN WELL-ESTABLISHED OUTFLOW ALOFT...AND DESPITE THE INTERACTION WITH MOUNTAINOUS TERRAIN...THE STORM HAS A RELATIVE WELL-ORGANIZED APPEARANCE IN SATELLITE IMAGERY. THE SYSTEM APPEARS TO BE CONTINUING WESTWARD AT ABOUT 270/12 TO THE SOUTH OF A NARROW MID-LEVEL RIDGE OVER THE WESTERN ATLANTIC. THE SYNOPTIC REASONING...DYNAMICAL MODEL TRACKS...AND THE OFFICIAL FORECAST TRACK ARE NOT SIGNIFICANTLY CHANGED FROM THE PREVIOUS ADVISORY. ALL OF THE MODELS FORECAST THE MID- TO UPPER-LEVEL TROUGH OVER THE EASTERN U.S. TO GRADUALLY ERODE THE RIDGE DURING THE NEXT COUPLE OF DAYS...ALLOWING FAY TO TURN TO THE RIGHT INTO THE WEAKNESS...EVENTUALLY LEADING TO A NORTH-NORTHWESTWARD MOTION IN 3-5 DAYS. THE NEW OFFICIAL TRACK IS VERY CLOSE TO THE PREVIOUS ONE AND TO THE MODEL CONSENSUS...BUT THERE ARE RELIABLE MODELS ON BOTH SIDES OF THAT TRACK. THE GFDL AND HWRF TRACKS HEAD UP THE WESTERN PORTION OF THE FLORIDA PENINSULA IN A FEW DAYS...WHILE THE GFS AND UKMET ARE FARTHER WEST OVER THE EASTERN GULF OF MEXICO. IN THE SHORTER TERM...THE MODELS ALSO DO NOT AGREE ON WHETHER THE CENTER OF FAY WILL PASS OVER OR JUST SOUTH OF SOUTHEASTERN CUBA BEFORE TURNING NORTHWESTWARD. THESE DIFFERING SOLUTIONS AGAIN HIGHLIGHT THE PITFALLS OF FOCUSING TOO MUCH ON THE EXACT OFFICIAL FORECAST TRACK...ESPECIALLY AT THE LONGER RANGES. INTENSITY FORECASTING IS ALWAYS DIFFICULT...BUT IN THIS CASE IS MADE EVEN MORE COMPLICATED BY THE LIKELY INTERACTIONS WITH LAND DURING THE NEXT FEW DAYS. ATMOSPHERIC AND OCEAN CONDITIONS ALONG THE FORECAST TRACK APPEAR RATHER CONDUCIVE FOR STRENGTHENING...SO THE MORE TIME FAY SPENDS OVER WATER...THE STRONGER IT IS LIKELY TO BECOME...AND VICE VERSA. DYNAMICAL MODEL FIELDS INDICATE THAT THE WEAK-SHEAR ENVIRONMENT AROUND FAY SHOULD PERSIST THROUGHOUT MOST OF THE FIVE-DAY FORECAST PERIOD...WITH PERHAPS A MODEST BUT TEMPORARY INCREASE IN SHEAR IN ROUGHLY 48 HOURS. WHEN FAY IS OVER WATER...THOSE WATERS WILL BE VERY WARM. SINCE THE OFFICIAL TRACK IMPLIES AMPLE AMOUNT OF TIME OVER WATER...STEADY STRENGTHENING IS FORECAST...IN A MANNER SIMILAR TO THE GFDL MODEL. FAY COULD BE WEAKER THAN FORECAST IF ITS STAY OVER HISPANIOLA HAS SUBSTANTIALLY DISRUPTED THE CIRCULATION...OR IF IT MOVES FARTHER NORTH AND EAST AND SPENDS MORE TIME OVER CUBA. A TRACK FARTHER SOUTH AND WEST...HOWEVER...COULD ALLOW FAY TO GET STRONGER THAN WHAT IS SHOWN BELOW. FORECAST POSITIONS AND MAX WINDS INITIAL 16/0900Z 18.7N 72.0W 40 KT 12HR VT 16/1800Z 19.0N 74.0W 40 KT 24HR VT 17/0600Z 19.6N 76.4W 50 KT 36HR VT 17/1800Z 20.5N 78.3W 55 KT 48HR VT 18/0600Z 21.8N 79.9W 65 KT...NEAR S COAST OF CUBA 72HR VT 19/0600Z 25.0N 82.0W 70 KT 96HR VT 20/0600Z 28.5N 83.5W 80 KT 120HR VT 21/0600Z 32.0N 84.5W 35 KT...INLAND
-
WE KNOW THAT THE CENTER OF FAY IS SOMEWHERE OVER HISPANIOLA AND THE IMMEDIATE UNKNOWN IS HOW MUCH OF FAY WILL EMERGE OVER THE CARIBBEAN WATERS IN ABOUT 12 HOUR OR SO. BY LOOKING AT THE IMPRESSIVE SATELLITE PRESENTATION WITH DEEP CONVECTION...OUTFLOW IN ALL QUADRANTS AND THE STEADY WESTWARD MOTION...IT IS FAIR TO ASSUME THAT FAY COULD SURVIVE THE HIGH MOUNTAINS OF HISPANIOLA AND MOVE ...ALTHOUGH WEAKER...OVER THE GULF OF GONAVE SATURDAY MORNING. IF SO...A NEW PROCESS OF INTENSIFICATION SHOULD BEGIN SINCE THE SHEAR IS LIGHT AND THE WATERS ARE VERY WARM SOUTH OF CUBA. ONLY THE INTERACTION WITH THE HIGH TERRAIN OF EASTERN CUBA WOULD IMPEDE STRENGTHENING. IN FACT...MOST OF THE INTENSITY GUIDANCE SUGGESTS STRENGTHENING WITH THE HWRF BEING THE MOST AGGRESSIVE...MAKING FAY A STRONG HURRICANE SOUTH OF CUBA AND EVEN A STRONGER ONE OVER THE EASTERN GULF OF MEXICO AFTER CROSSING CUBA. THE OFFICIAL FORECAST IS MORE CONSERVATIVE AND CALLS FOR A GRADUAL STRENGTHENING BUT SHOWS A LITTLE MORE INTENSIFICATION THAN THE PREVIOUS FORECAST SIMPLY BECAUSE FAY IS EXPECTED TO STAY LONGER OVER WATER IN THIS FORECAST. BECAUSE WE DO NOT KNOW WHERE THE CENTER IS...THE INITIAL MOTION IS HIGHLY UNCERTAIN. THE BEST ESTIMATE OF THE INITIAL MOTION USING CONTINUITY AND THE MOTION OF THE OVERALL CLOUD MASS IS 275 DEGREES AT 12 KNOTS. FAY IS FORECAST TO MOVE ON THIS GENERAL TRACK FOR THE NEXT DAY OR SO AROUND THE SUBTROPICAL RIDGE CENTERED OVER THE WESTERN ATLANTIC. BUT IN 2 OR 3 DAYS...A MID-LEVEL TROUGH IS FORECAST TO REACH THE GULF OF MEXICO ERODING THE RIDGE. THIS PATTERN SHOULD FORCE FAY TO TAKE A MORE NORTHWESTERLY AND NORTH-NORTHWESTERLY TRACK ACROSS CENTRAL CUBA AND THE EXTREME EASTERN GULF OF MEXICO. ONE SHOULD MENTION HERE THAT IN GENERAL...MOST OF THE GUIDANCE HAS SHIFTED WESTWARD AND THE OFFICIAL FORECAST IS ON THE EASTERN EDGE OF THE ENVELOPE. BEFORE I AM COMMITTED TO SHIFT THE TRACK FARTHER WEST...I WOULD RATHER WAIT TO SEE IF GUIDANCE BECOMES MORE STABLE FROM ONE RUN TO THE NEXT. IN SUMMARY...BOTH OFFICIAL FORECAST AND GUIDANCE SHOW AN INTENSIFYING TROPICAL CYCLONE MOVING ACROSS CENTRAL CUBA AND INTO THE EXTREME SOUTHEASTERN GULF OF MEXICO. WE MUST PAY VERY CLOSE ATTENTION TO THE EVOLUTION OF THIS TROPICAL CYCLONE. source.. noaa
-
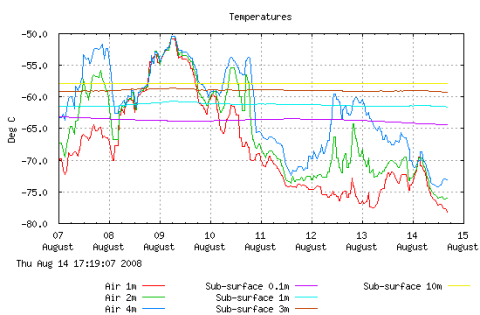
Latitude: 80 22" 02'S Longitude: 77 32"21'E Height: 4084 m Latest minimum temperature at Dome A, Thursday 14 August 2008, 11:28 PM: -79.1°C (-110.3°F)

-
C'est moi la Référence !!!! c'est ma prévision You could take it with a grain of salt....
-
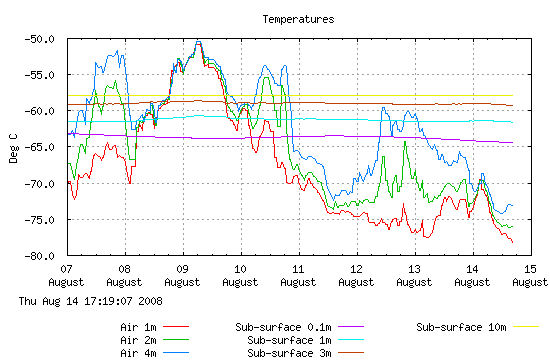
DOME A RECORD CHART....
-
Latitude: 80 22" 02'S Longitude: 77 32"21'E Height: 4084 m Latest 24-hour-minimum temperature: -78.2°C for DOME A
-
PAS DE EL NINO CETTE HIVER !!!! Temps will still be in normal mode in the pacific basin by November and below normal by january. Winters of this calibre bring extreme temp swings for southern Quebec. If i would take a guess this winter it would be like the winter of 2002-03 for temps only and for precip normal to above normal towards the end of winter.
-
Oui cest vrai very good idea i will indeed have a new title LIVE FROM THE POLES... MERCI AND THANKS FOR THE SUGGESTIONS....